
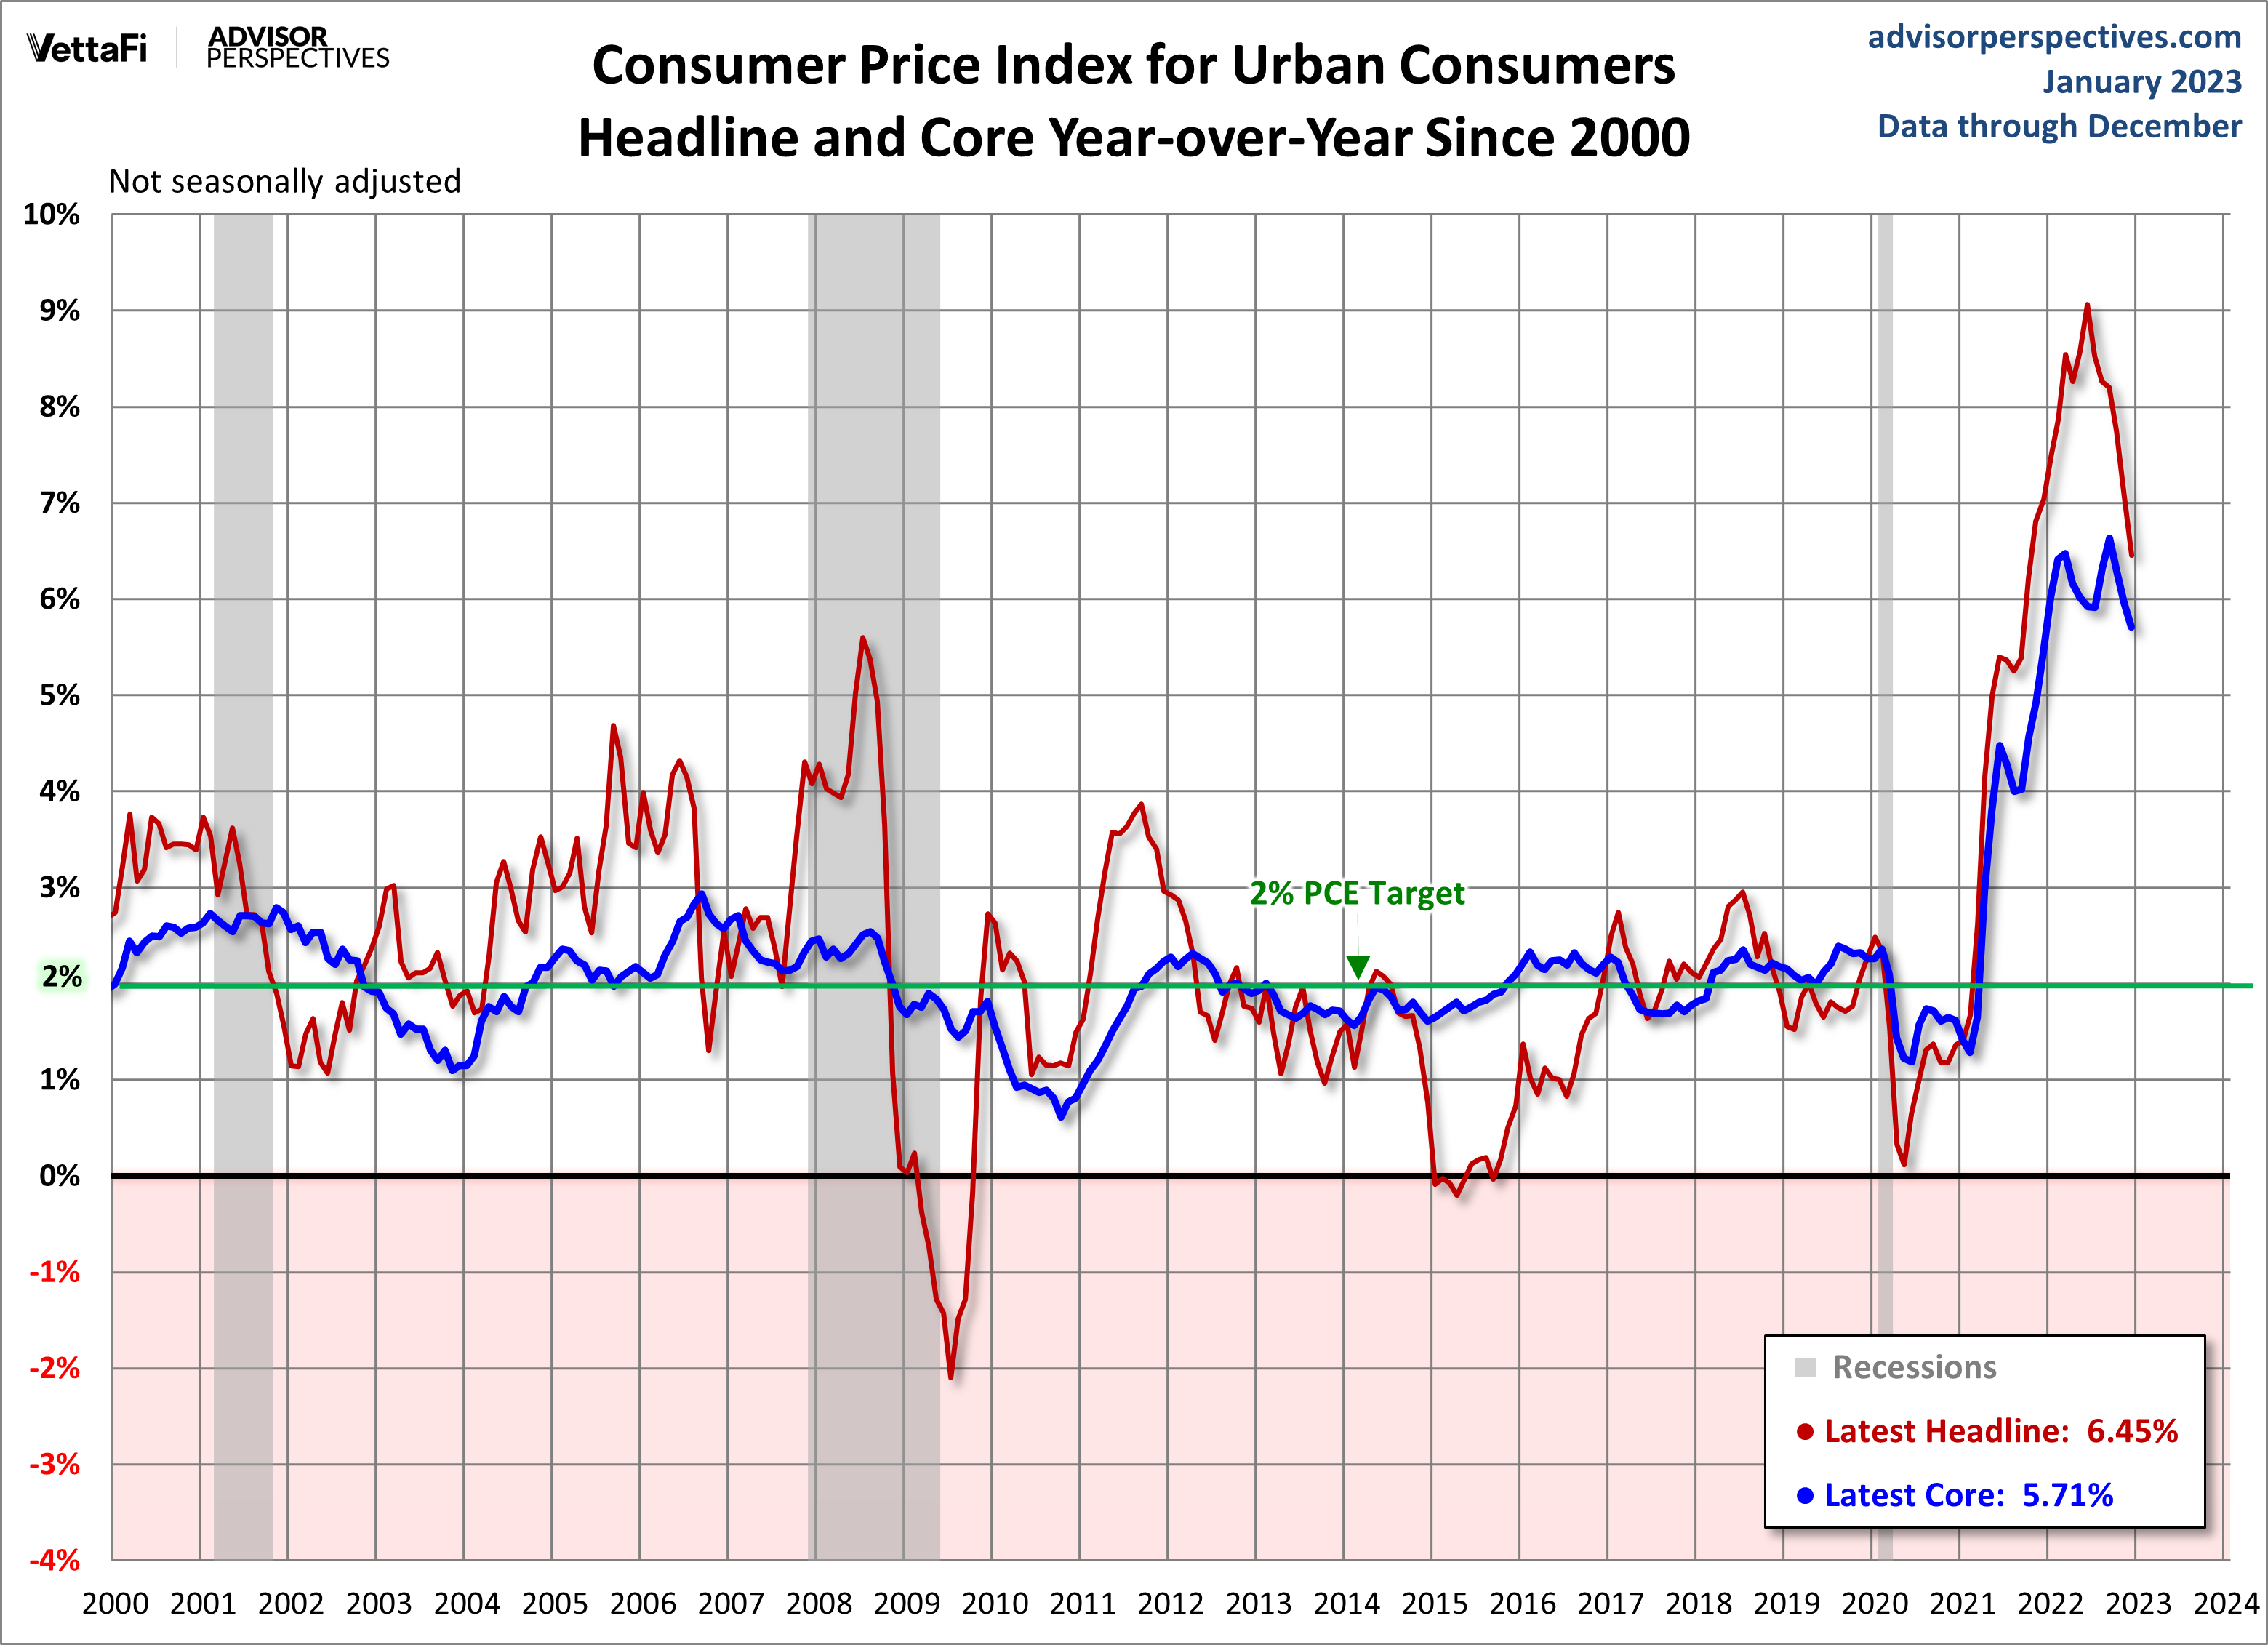
The Bureau of Labor Statistics released the December Consumer Price Index data this morning. The year-over-year non-seasonally adjusted Headline CPI came in at 6.45%, down from 7.11% the previous month. Year-over-year Core CPI (ex Food and Energy) came in at 5.71%, down from 5.96% the previous month.
Here is the introduction from the BLS summary, which leads with the seasonally adjusted monthly data:
The Consumer Price Index for All Urban Consumers (CPI-U) declined 0.1 percent in December on a seasonally adjusted basis, after increasing 0.1 percent in November, the U.S. Bureau of Labor Statistics reported today. Over the last 12 months, the all items index increased 6.5 percent before seasonal adjustment.
The index for gasoline was by far the largest contributor to the monthly all items decrease, more than offsetting increases in shelter indexes. The food index increased 0.3 percent over the month with the food at home index rising 0.2 percent. The energy index decreased 4.5 percent over the month as the gasoline index declined; other major energy component indexes increased over the month.
The index for all items less food and energy rose 0.3 percent in December, after rising 0.2 percent in November. Indexes which increased in December include the shelter, household furnishings and operations, motor vehicle insurance, recreation, and apparel indexes. The indexes for used cars and trucks, and airline fares were among those that decreased over the month.
The all items index increased 6.5 percent for the 12 months ending December; this was the smallest 12-month increase since the period ending October 2021. The all items less food and energy index rose 5.7 percent over the last 12 months. The energy index increased 7.3 percent for the 12 months ending December, and the food index increased 10.4 percent over the last year; all of these increases were smaller than for the 12-month period ending November.
Investing.com was looking for a 0.0% MoM change in seasonally adjusted Headline CPI and a 0.3% in Core CPI. Year-over-year forecasts were 6.5% for Headline and 5.7% for Core.
The first chart is an overlay of Headline CPI and Core CPI (the latter excludes Food and Energy) since the turn of the century. The highlighted two percent level is the Federal Reserve's Core inflation target for the CPI's cousin index and the BEA's Personal Consumption Expenditures (PCE) price index.
The next chart shows both series since 1957, the year the government first began tracking Core Inflation.
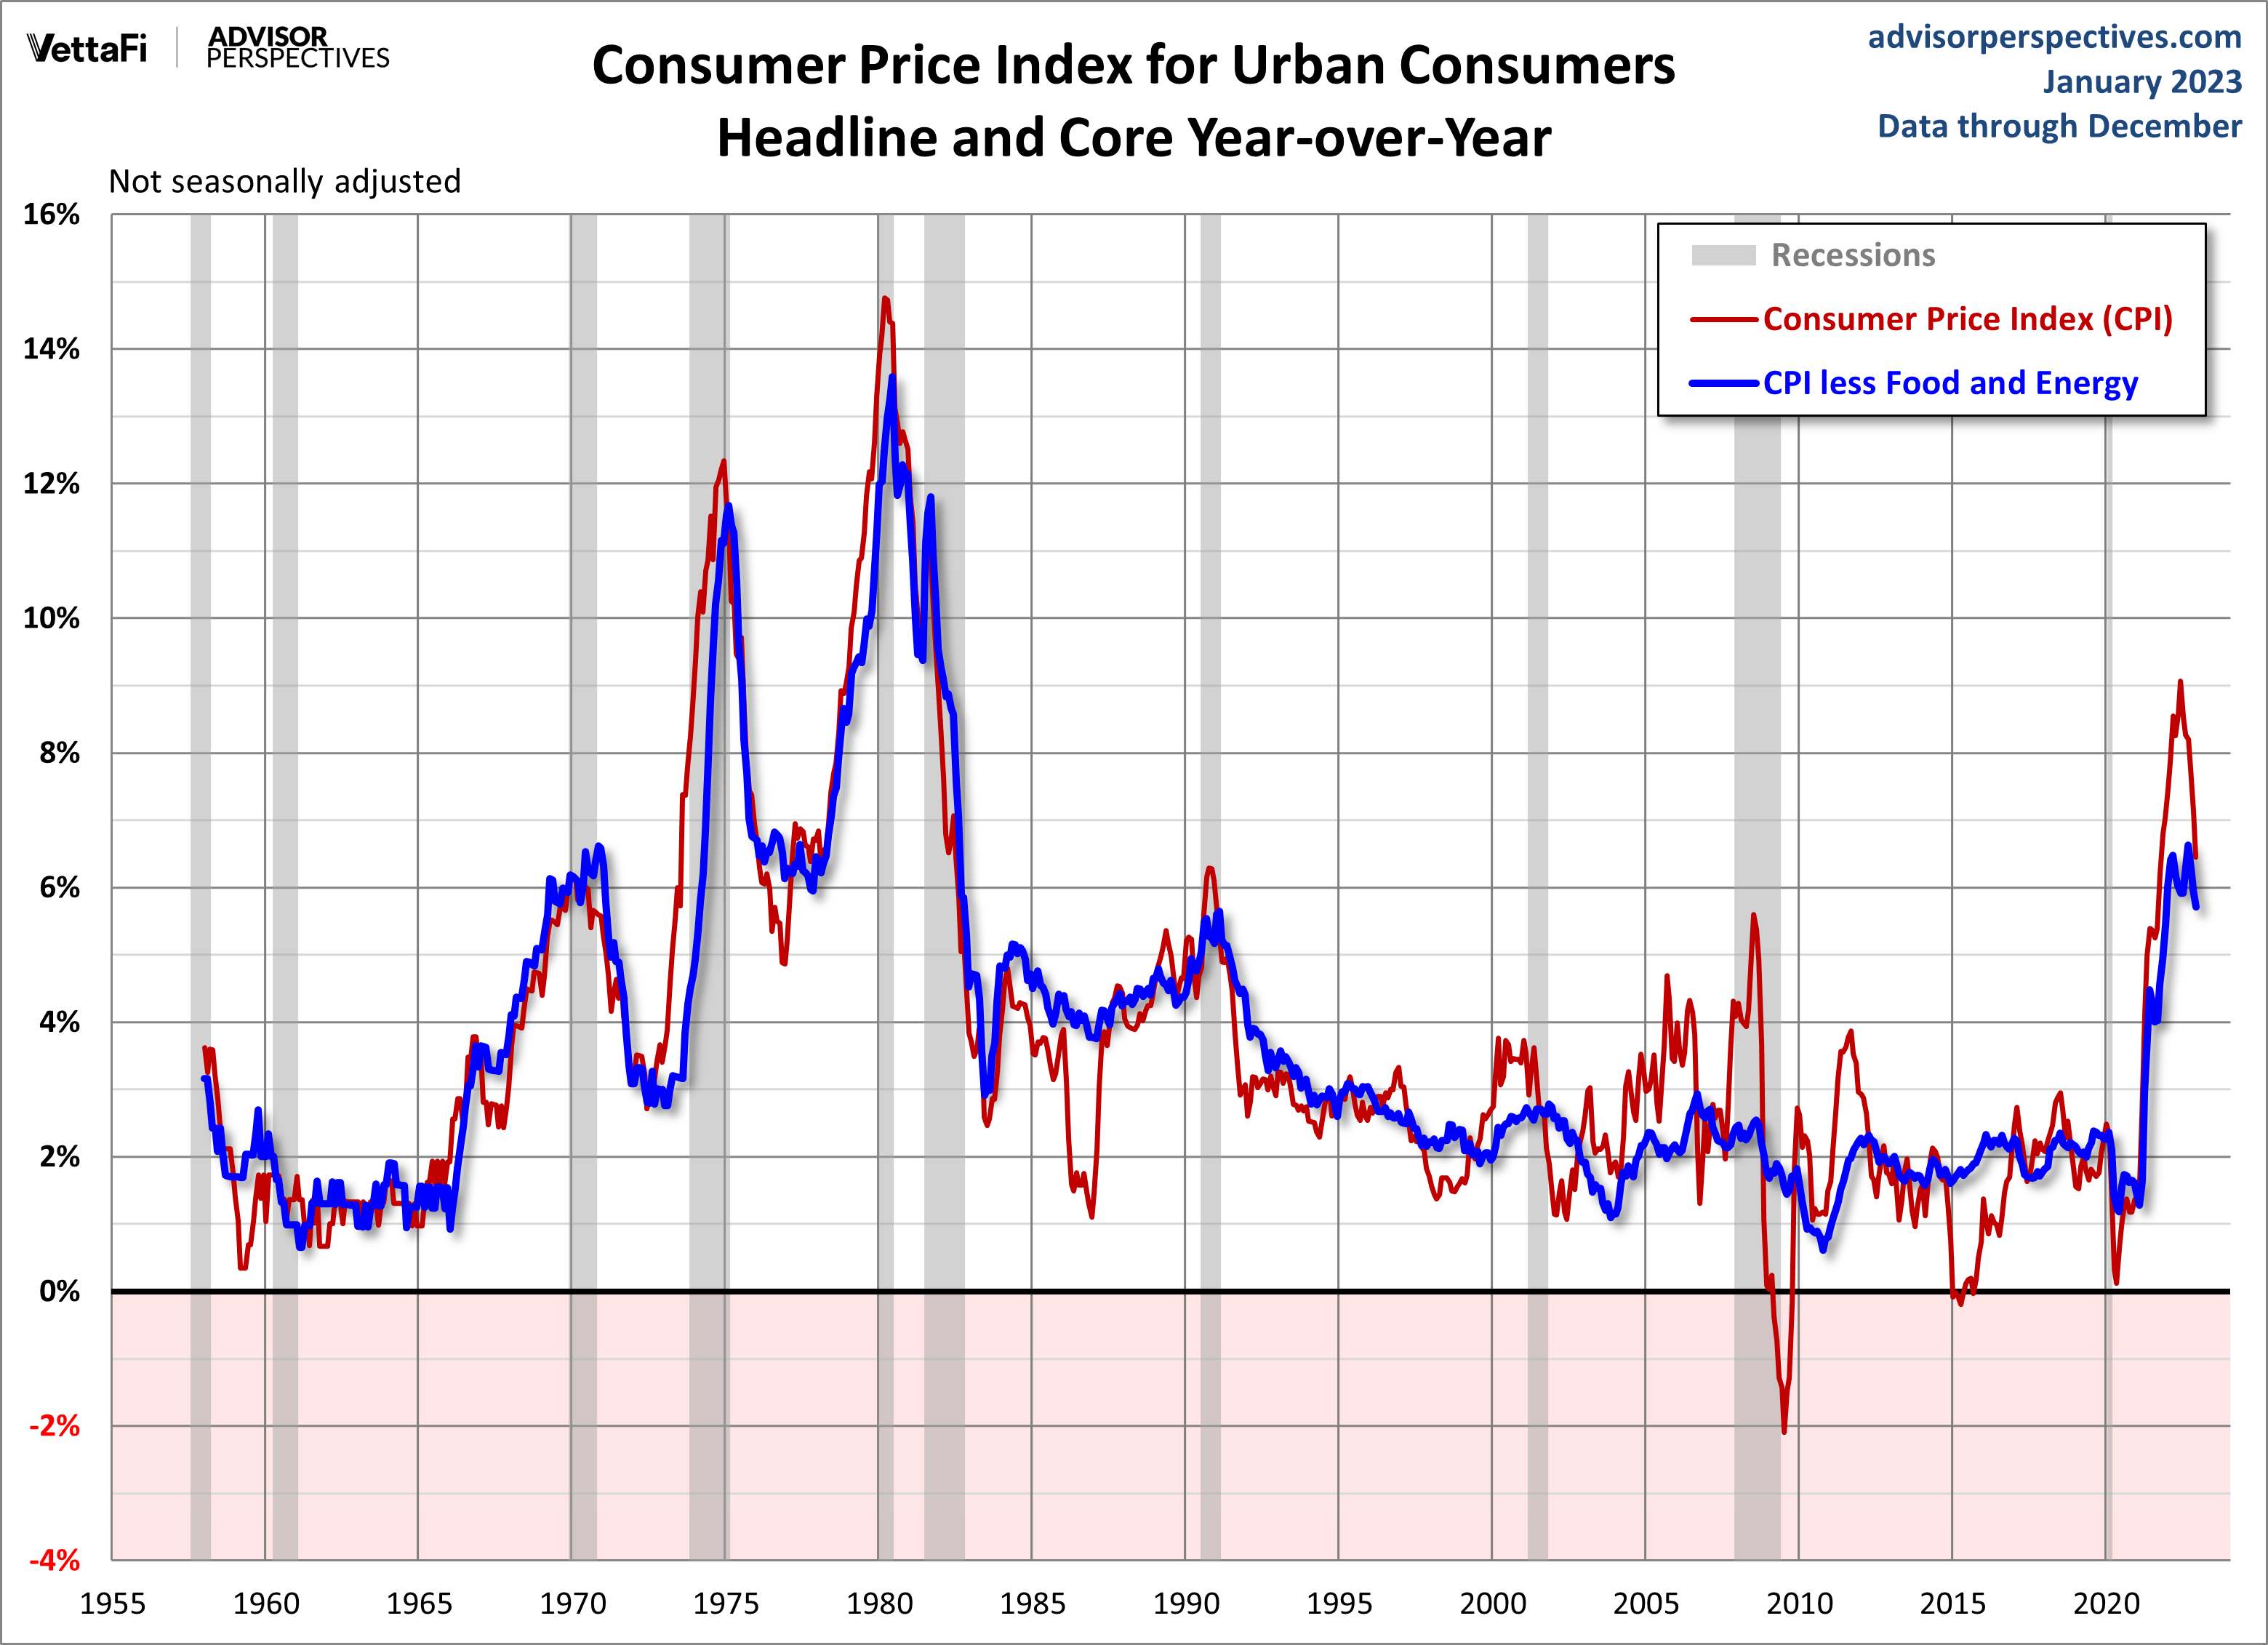
In the wake of the Great Recession, two percent has been the Fed's target for core inflation. However, at their December 2012 FOMC meeting, the inflation ceiling was raised to 2.5% while their accommodative measures (low Fed Funds Rate and quantitative easing) were in place. They have since reverted to the two percent target in their various FOMC documents. The COVID-19 pandemic helped launch inflation to its highest levels since the 1980s.
Federal Reserve policy, which in recent history has focused on core inflation measured by the core PCE Price Index, will see that the more familiar core CPI is now well above the PCE target range of 2 percent. The Fed has been in a tightening cycle to tackle high inflation, among other things. Inflation has been easing as of late, but it may not be enough to curb a recession.
More By This Author:
Cryptocurrencies Through January 11
U.S. Workforce: December 2022 Update
Weekly Gasoline Prices: Regular and Premium Up


Comments
Log in or sign up to join the conversation.