
XAU/USD Faces Renewed Selling Pressure As FOMC Beckons
XAU/USD Fundamental Backdrop
XAU/USD continued its descent in European trade as renewed Fed rate hike bets and dollar strength returned. Any hopes of an early pivot by the US Federal Reserve were dealt a blow last week as US GDP as well as core inflation numbers both injected a fresh bout of rate hike optimism helping the DXY pare some early week losses.
As we approach this week’s meeting, however, the outlook moving forward remains uncertain. This comes as a host of Federal Reserve policymakers have in recent weeks tempered their language regarding rate hikes beyond Thursday’s meeting. The change in outlook from certain policymakers stems from fears of potentially hiking into a recession which could create bigger problems down the road.
Given the change in rhetoric, markets seem to be pricing in a less aggressive Fed at this week’s meeting, at least in terms of the forward guidance provided. Interest rates are still expected to peak around the 5-5.25% mark in early 2023 however, the probabilities of this have declined over the past week even with the positive GDP and core inflation numbers supporting further hikes. All of the above may suggest that the ‘pivot’ from the Fed may not be far off which makes this week’s meeting all the more important.
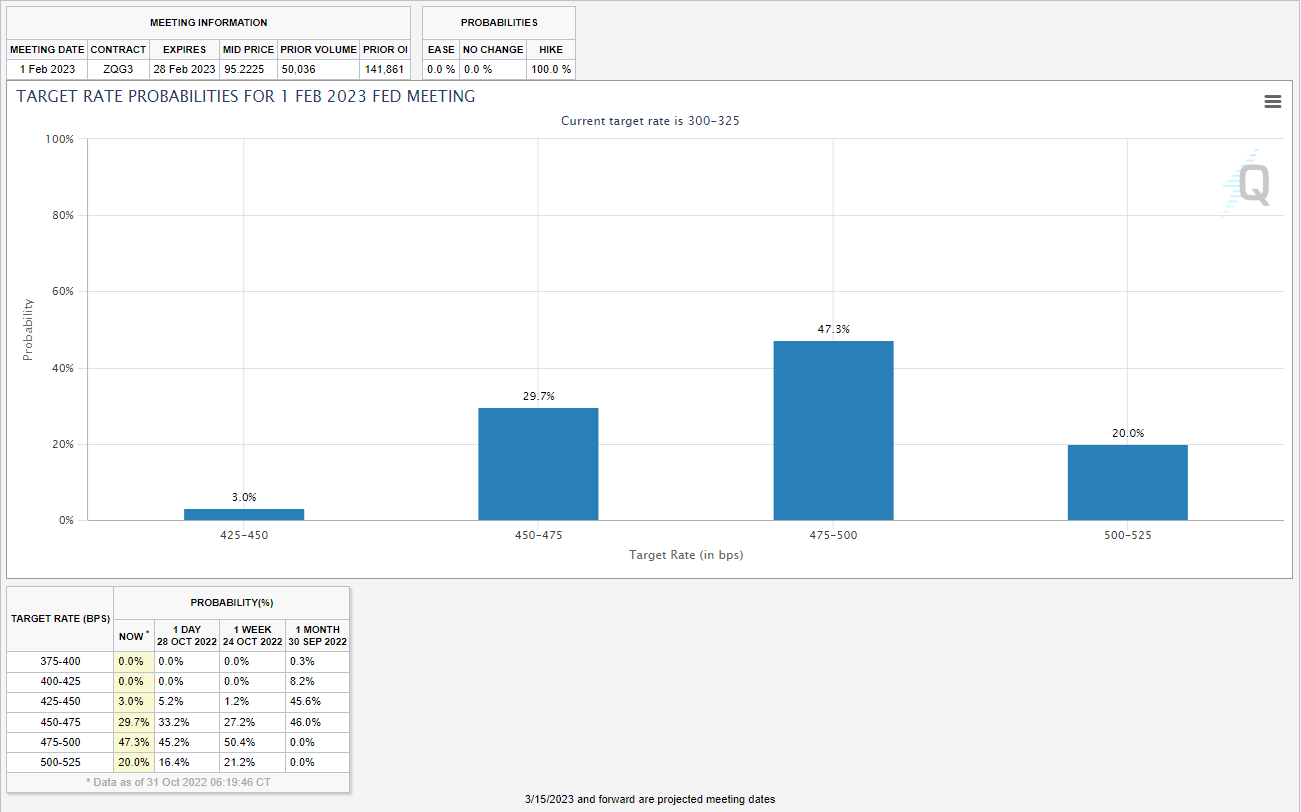
Source: CME FedWatch Tool
Given a slightly dovish stance expected by the Federal Reserve, the only way to avoid a potential 5th rate hike of 75bp in December will rest on a slowdown in inflation numbers. At present this seems like a pipe dream. It will remain important to gauge the comments by the Federal Reserve on Thursday, as the possibility of a 50 or 25bp hike in December continue to grow.
Later in the week, we have non-farm payrolls out of the US, which will be the first significant data release post-FOMC. This will be of interest especially if the Fed reiterates the need to keep a close watch on data prints to guide further hikes moving forward.
XAU/USD Daily Chart – October 31, 2022
(Click on image to enlarge)
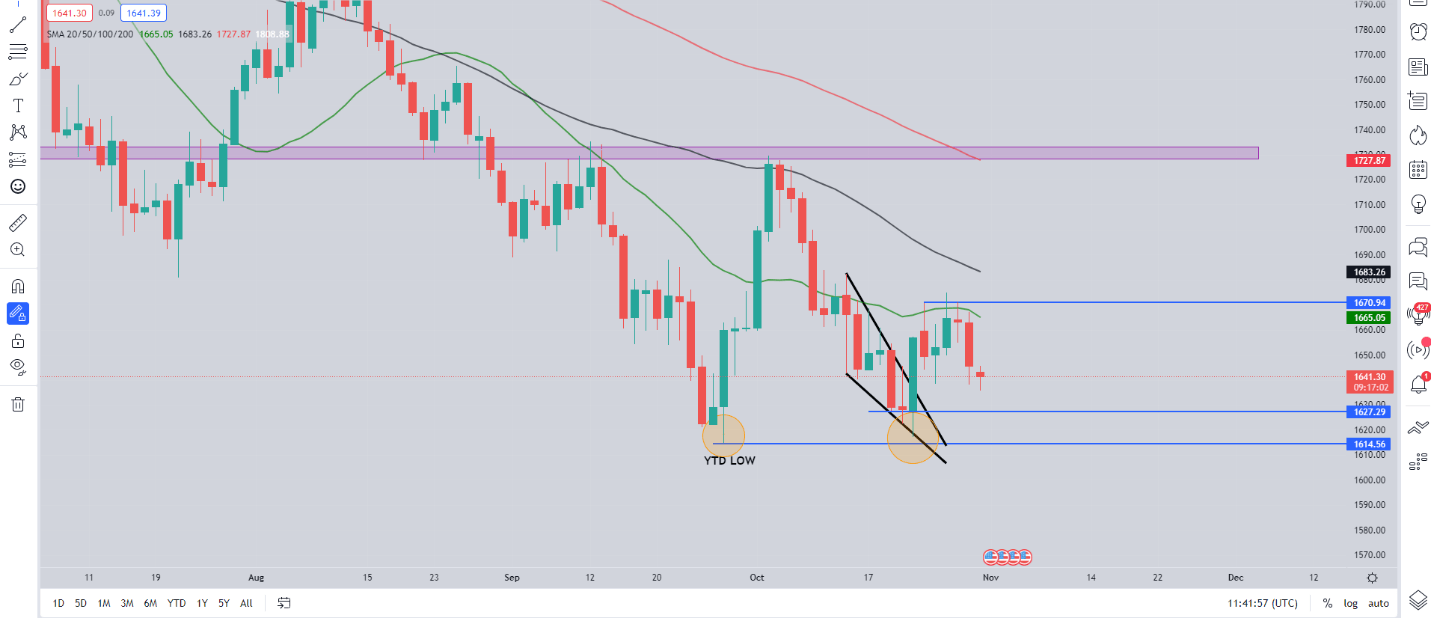
Source: TradingView
From a technical perspective, last week was the end of the month which saw the precious metal record its seventh consecutive month of losses. We remain within the range of $1614-$1670 as any gains last week were capped without any significant catalyst.
On the weekly timeframe, we had a shooting star candlestick close which would hint at a further downside. Gold needs a breakout of this range with the FOMC likely to provide the much-needed volatility and certainty around the dollar moving forward.
On the daily timeframe, gains are being capped in the 20-SMA and $1670 resistance area. A daily candle break and close above the resistance could result in a rally while a break below the YTD low at $1614 could see further downside.
Key intraday levels that are worth watching:
Support Areas
- 1630
- 1614
- 1600
Resistance Areas
- 1661
- 1670
- 1685
More By This Author:
AUD/USD Forecast: Aussie Inflationary Landscape A Cause For ConcernJapanese Yen in Flux on Data and the Chinese Yuan Battles Soft Sentiment
AUD/USD Eyes Australian Retail Sales and China PMI Data as Iron Ore Prices Pose Headwind
Disclosure: See the full disclosure for DailyFX here.


