

In the long term, XAGUSD is probably building a triple zigzag consisting of cycle waves w-x-y-x-z.
The current chart shows the internal structure of the second Intervening wave x. This could be a triple zigzag of the primary degree Ⓦ-Ⓧ-Ⓨ-Ⓧ-Ⓩ.
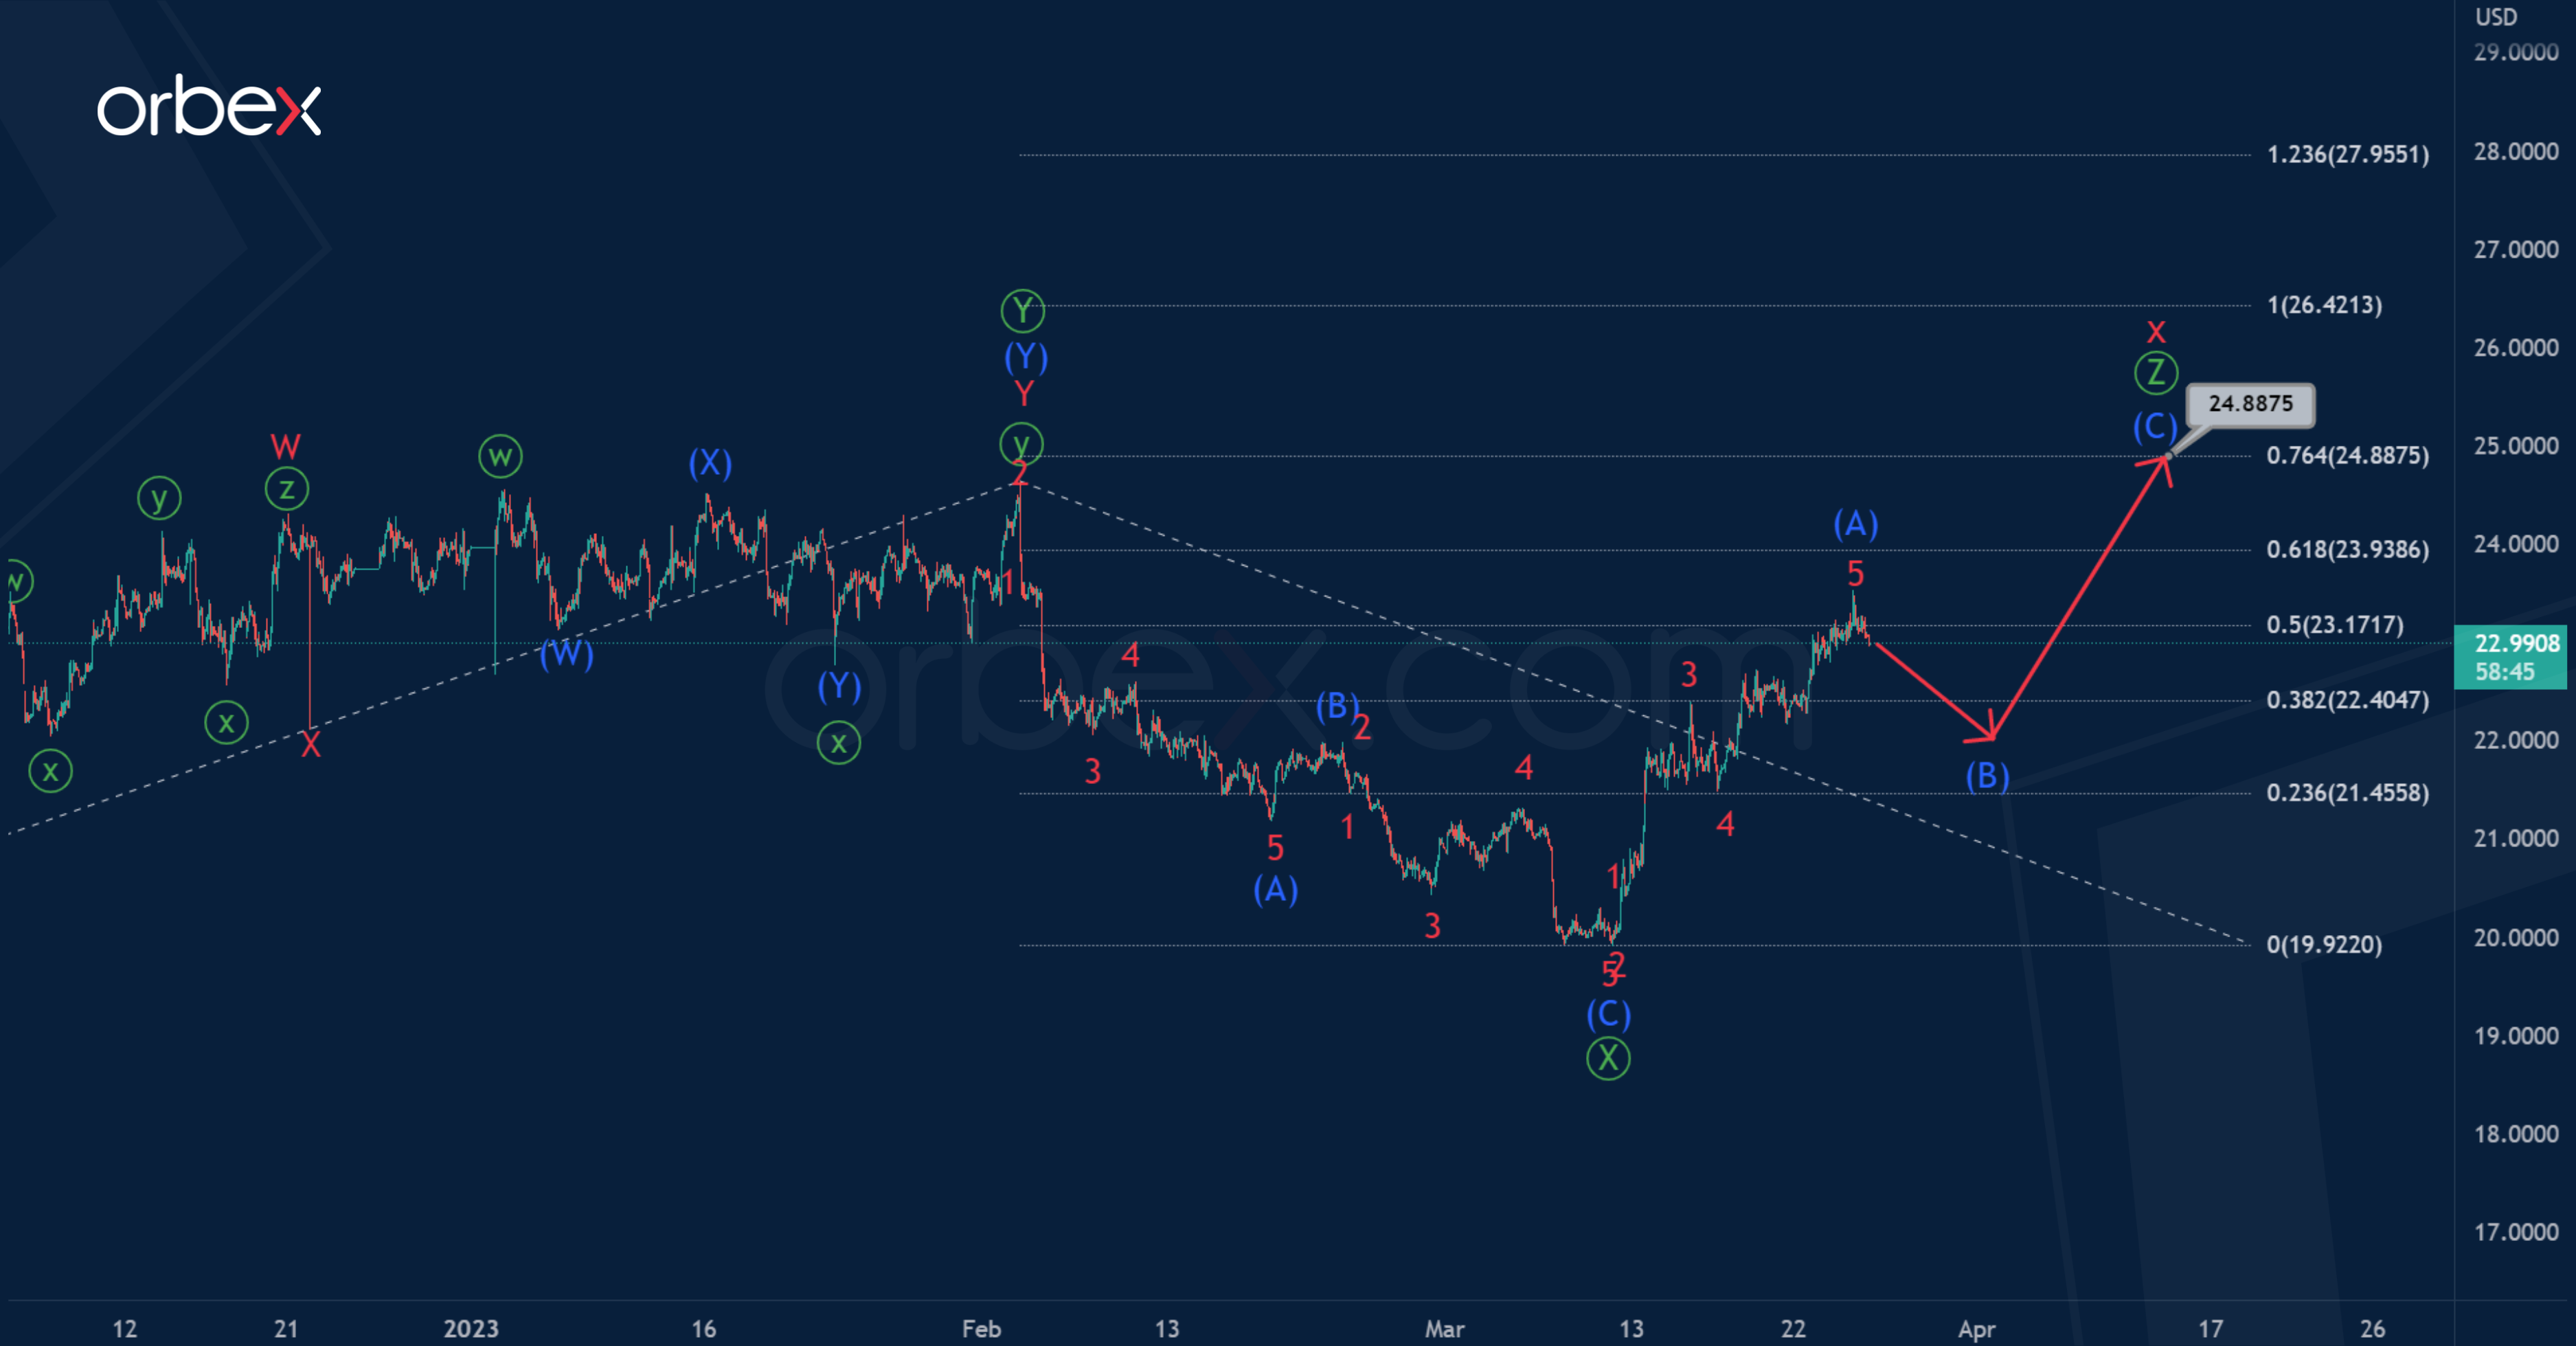
The primary wave Ⓨ consists of intermediate waves (W)-(X)-(Y) and looks finished. Perhaps the primary intervening wave Ⓧ could also end. Currently, it has the form of a zigzag (A)-(B)-(C).
At the moment, the price could be in the primary wave Ⓩ, more precisely in its completed impulse (A). A slight correction (B) is likely in the near future after which growth will resume in (C) approximately to 24.887.
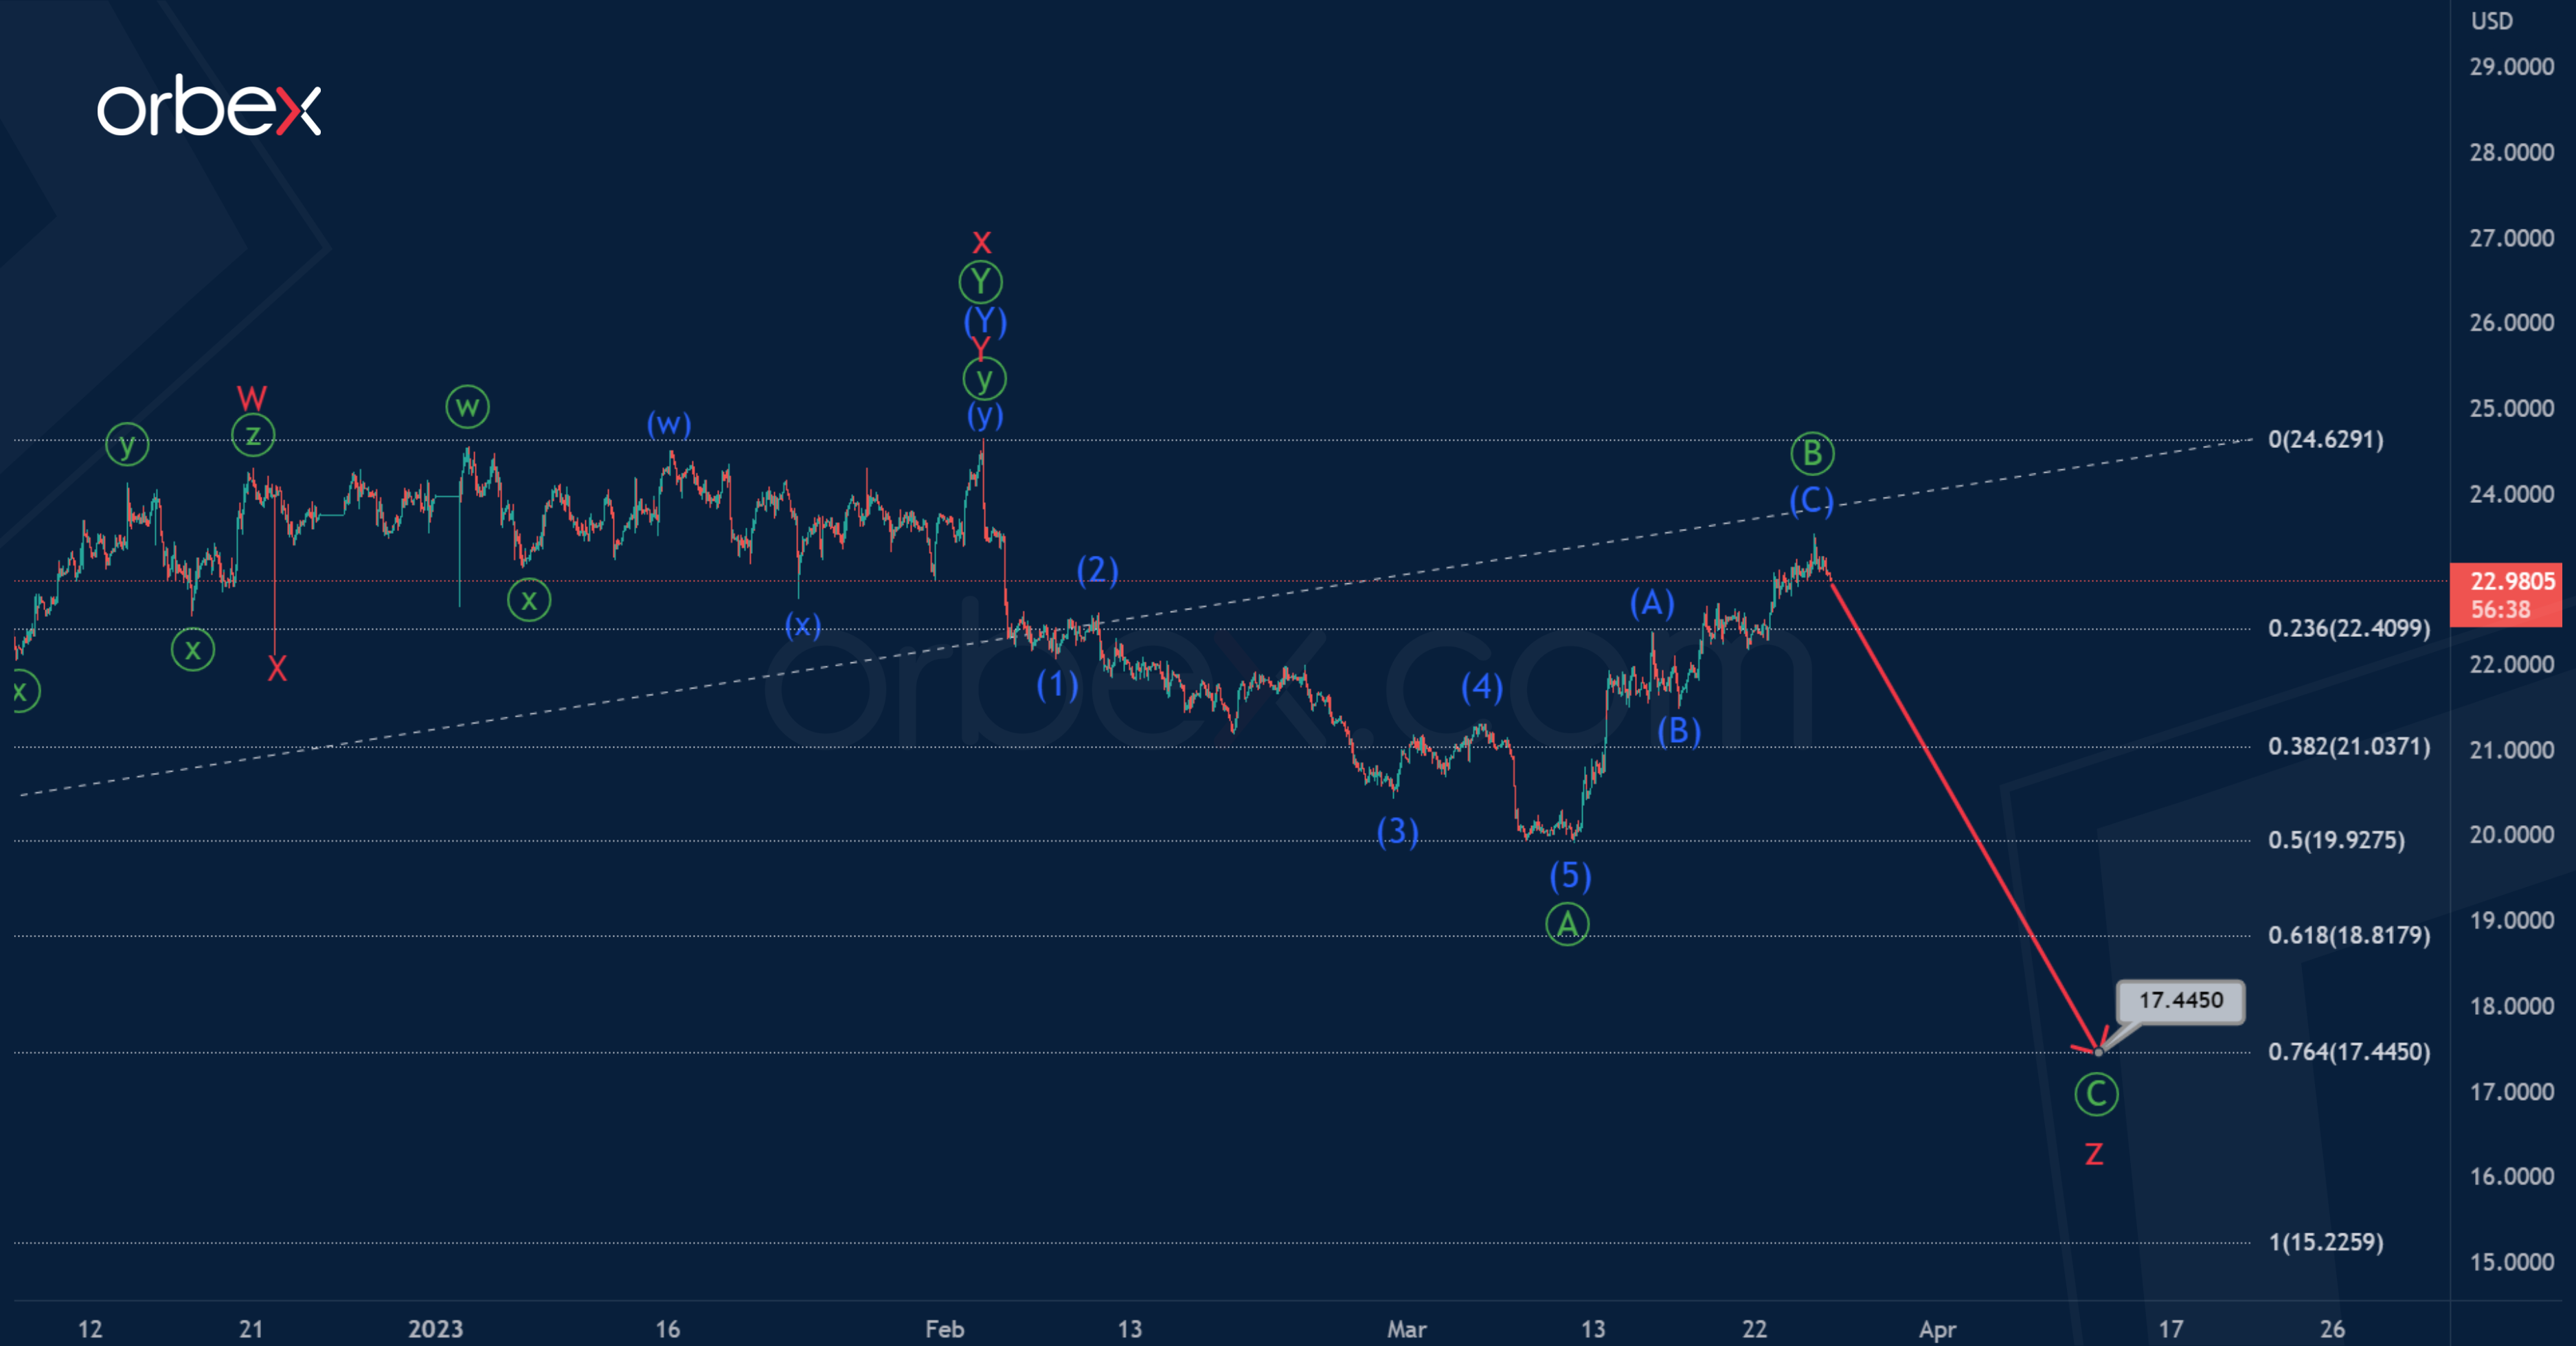
However, it is likely that the development of the cycle intervening wave x has ended. In the last section we see the initial part of a new bearish wave z.
The possible wave z will be a standard primary zigzag, and will complete its pattern near 17.445. At that level, it will be at 76.4% of actionary wave y.
Thus, in the near future XAGUSD could depreciate to the specified level in the impulse Ⓒ.
More By This Author:
Intraday Analysis – Dax Attempts To Bounce Back
The Week Ahead – Risk Mitigation
Can Gold Move Above $2,000/Oz?


Comments
Log in or sign up to join the conversation.