


Image Source: Pixabay
- Silver price could regain its ground as the daily chart analysis suggests a persistent bullish bias.
- The pair may appreciate toward its primary resistance around its two-month high of $32.28.
- The immediate support appears at a nine-day EMA of $30.82, followed by the ascending channel’s lower boundary.
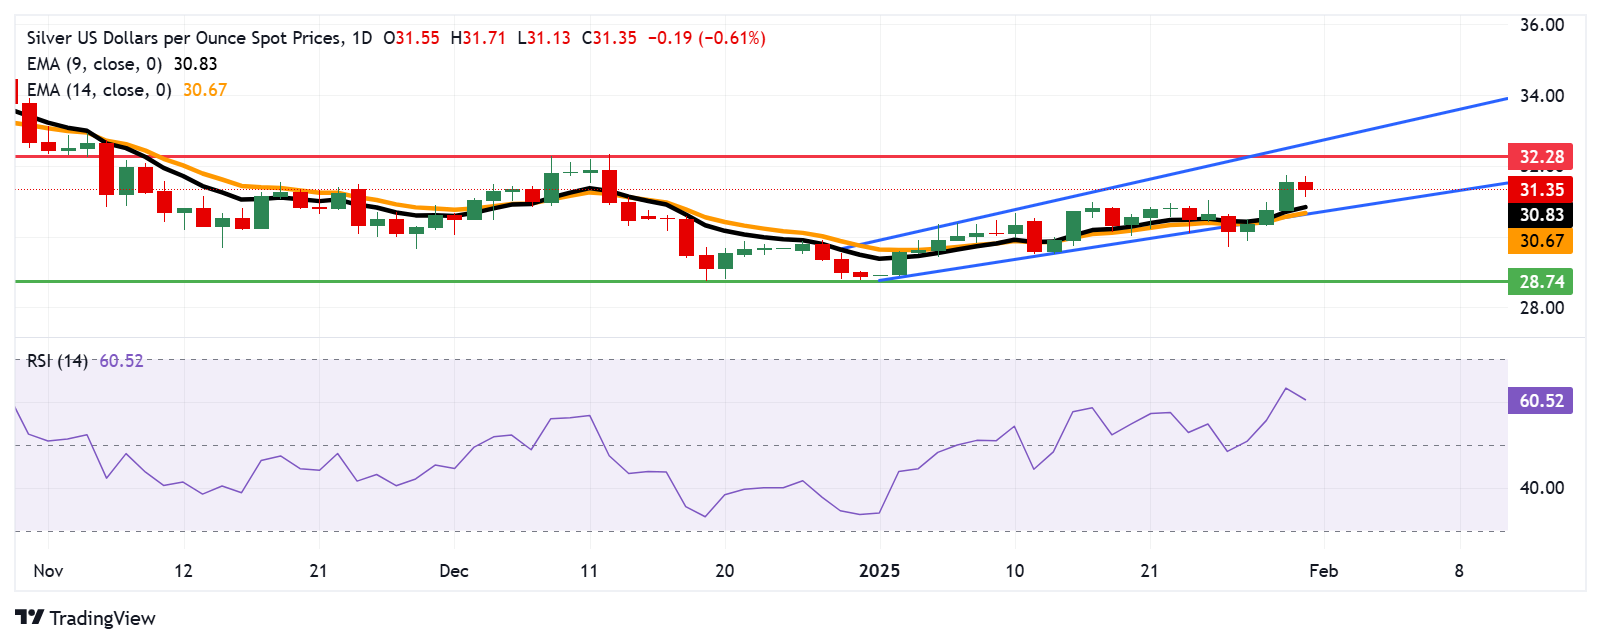
Silver price (XAG/USD) halts its three-day winning streak, trading around $31.30 per troy ounce during Asian hours on Friday. A daily chart analysis suggests a persistent bullish bias for the precious metal, as its price continues to rise within an ascending channel pattern.
The XAG/USD pair trades above both the nine-day and 14-day Exponential Moving Averages (EMAs), suggesting that short-term momentum is strong. Additionally, the 14-day Relative Strength Index (RSI) is positioned above the 50 level, reinforcing the active bullish sentiment.
On the upside, the Silver price could find its initial resistance around its two-month high of $32.28, last achieved on December 9. A break above this level would support the XAG/USD pair to test the upper boundary of the ascending channel at $32.60.
Immediate support is located at a nine-day EMA of $30.82, followed closely by a 14-day EMA of $30.66 which is aligned with the ascending channel’s lower boundary. A break below this crucial support zone would cause the emergence of the bearish bias and put pressure on the XAG/USD pair to navigate the region around its four-month low of $28.74, recorded on December 19.
XAG/USD: Daily Chart
More By This Author:
Australian Dollar Recovers Loses, Upside Seems Limited Due To Renewed Trump Tariff ThreatsAUD/JPY Drops Below 96.50, Further Downside Appears Due To Potential BoJ Rate Hikes
Australian Dollar Edges Higher As Export Prices Rise In Q4



Comments
Log in or sign up to join the conversation.