

Image Source: Pixabay
- Silver attracts some follow-through buying for the second straight day on Wednesday.
- The mixed technical indicators on hourly/daily charts warrant some caution for bulls.
- A break below the $28.00 mark is needed to negate any near-term positive outlook.
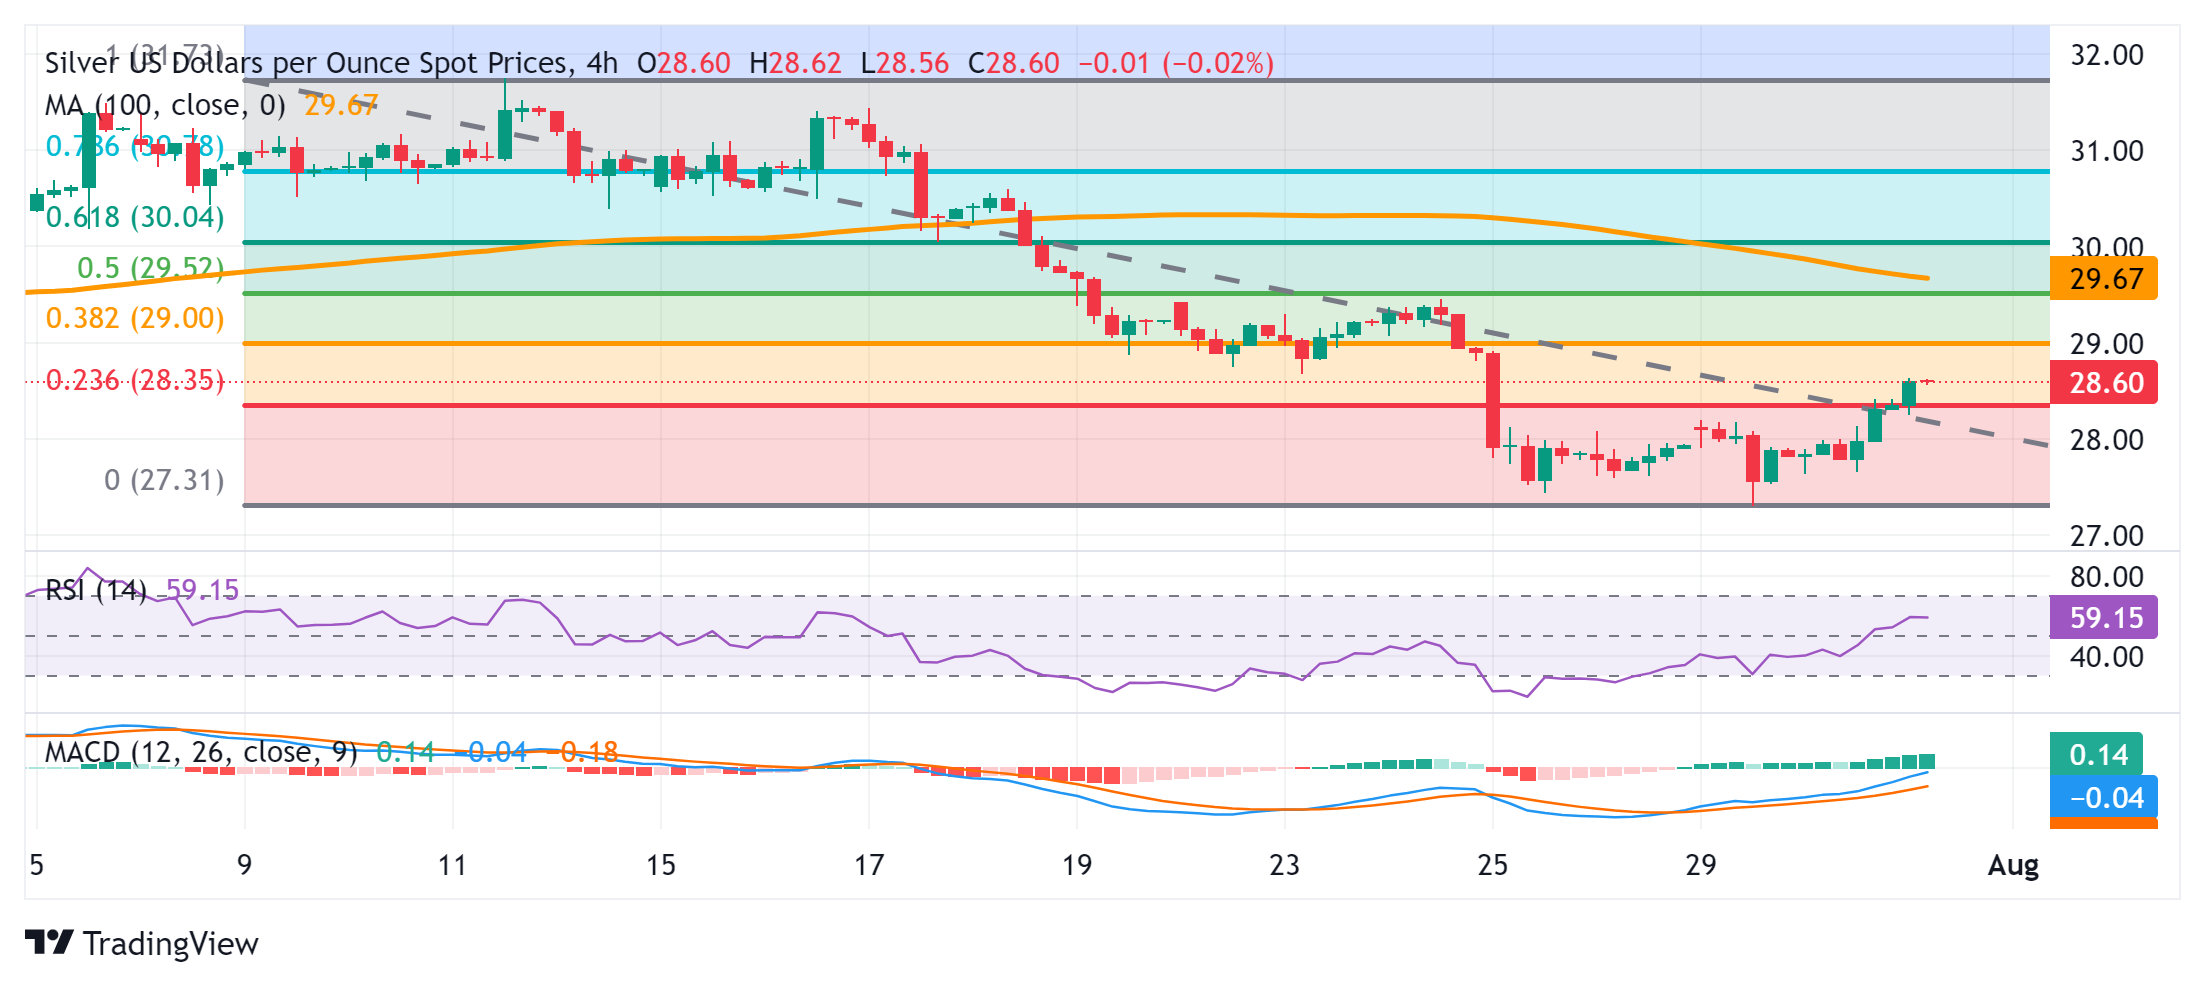
Silver (XAG/USD) scales higher for the second straight day on Wednesday and climbs to a multi-day peak during the Asian session on Wednesday. The white metal is currently trading around the $28.60 region, with bulls now looking to build on the momentum beyond the 100-day Simple Moving Average (SMA) support breakpoint-turned-resistance.
An intraday move beyond the 23.6% Fibonacci retracement level of the recent corrective decline from the $31.75 region, or the July monthly swing high, could be seen as a trigger for bullish traders. Moreover, oscillators on the 4-hour chart have been gaining positive traction and support prospects for a further intraday appreciating move. That said, technical indicators on the daily chart – though have recovered from lower levels – are still far away from confirming a positive outlook.
Hence, any subsequent move up is more likely to confront stiff resistance and remain capped near the $29.00 round-figure mark, which coincides with the 38.2% Fibo. level and should act as a key pivotal point. A sustained strength beyond, meanwhile, will suggest that the recent downfall witnessed over the past two weeks or so has run its course and lift the XAG/USD towards the next relevant hurdle near the $29.45-$29.50 supply zone, or last week's swing high and the 50% Fibo. level.
Some follow-through buying should pave the way for a move back towards reclaiming the $30.00 psychological mark, or the 61.8% Fibo. level. The momentum could extend further towards the 78.6% Fibo. level, around the $30.75-$30.80 region, before the XAG/USD eventually aims to retake the $31.00 round figure and test the monthly swing high, around the $31.75 zone.
On the flip side, the $28.30-$28.25 region, or the 23.6% Fibo. level now seems to protect the immediate downside ahead of the $28.00 mark. A convincing break below the latter will expose the $27.40-$27.30 zone, or the lowest level since May 9 touched on Monday. The next relevant support is pegged near the $27.00 mark, below which the XAG/USD could accelerate the fall to the $26.60-$26.55 support en route to the 200-day SMA, just below the $26.00 mark.
Silver 4-hour chart
More By This Author:
Gold Price Holds Above $2,400 Mark, Looks To Fed For More Cues On Interest RatesUS Dollar Recovery Stalls Amid A Mildly Brighter Market Sentiment
Gold Price Languishes Around $2,380, Looks To Fed Decision For Fresh Impetus


Comments
Log in or sign up to join the conversation.