
West Texas Intermediate (WTI) rose in late-day bidding on Friday as Crude Oil markets recover, but still remains within recent consolidation levels. US Crude Oil was propped up by a backslide in US barrel counts from the Energy Information Administration (EIA) and the American Petroleum Institute (API) this week, with broad-market risk appetite pinning deeper into ‘buy it all’ territory after US Consumer Price Index (CPI) inflation data eased more than expected in April.
Risk appetite increased during the latter half of the trading week after US inflation figures kicked investor hope for Federal Reserve (Fed) rate cuts higher, helping to drag Crude Oil bids up from its lowest bids since late February. Despite refreshed rate trim bids, Fedspeak is striking a notably moderate tone, with multiple Fed officials cautioning for patience on rates from the Fed, and the possibility that rates could remain higher for much longer than markets might be prepared for.
With Fedspeak dominating the financial news cycle to wrap up the trading week, investors will be bracing for early next week when a slew of Fed appearances show up on Monday and Tuesday. A volley of talking points from Fed policymakers will be hitting the wires in the front half of next trading week.
WTI technical outlook
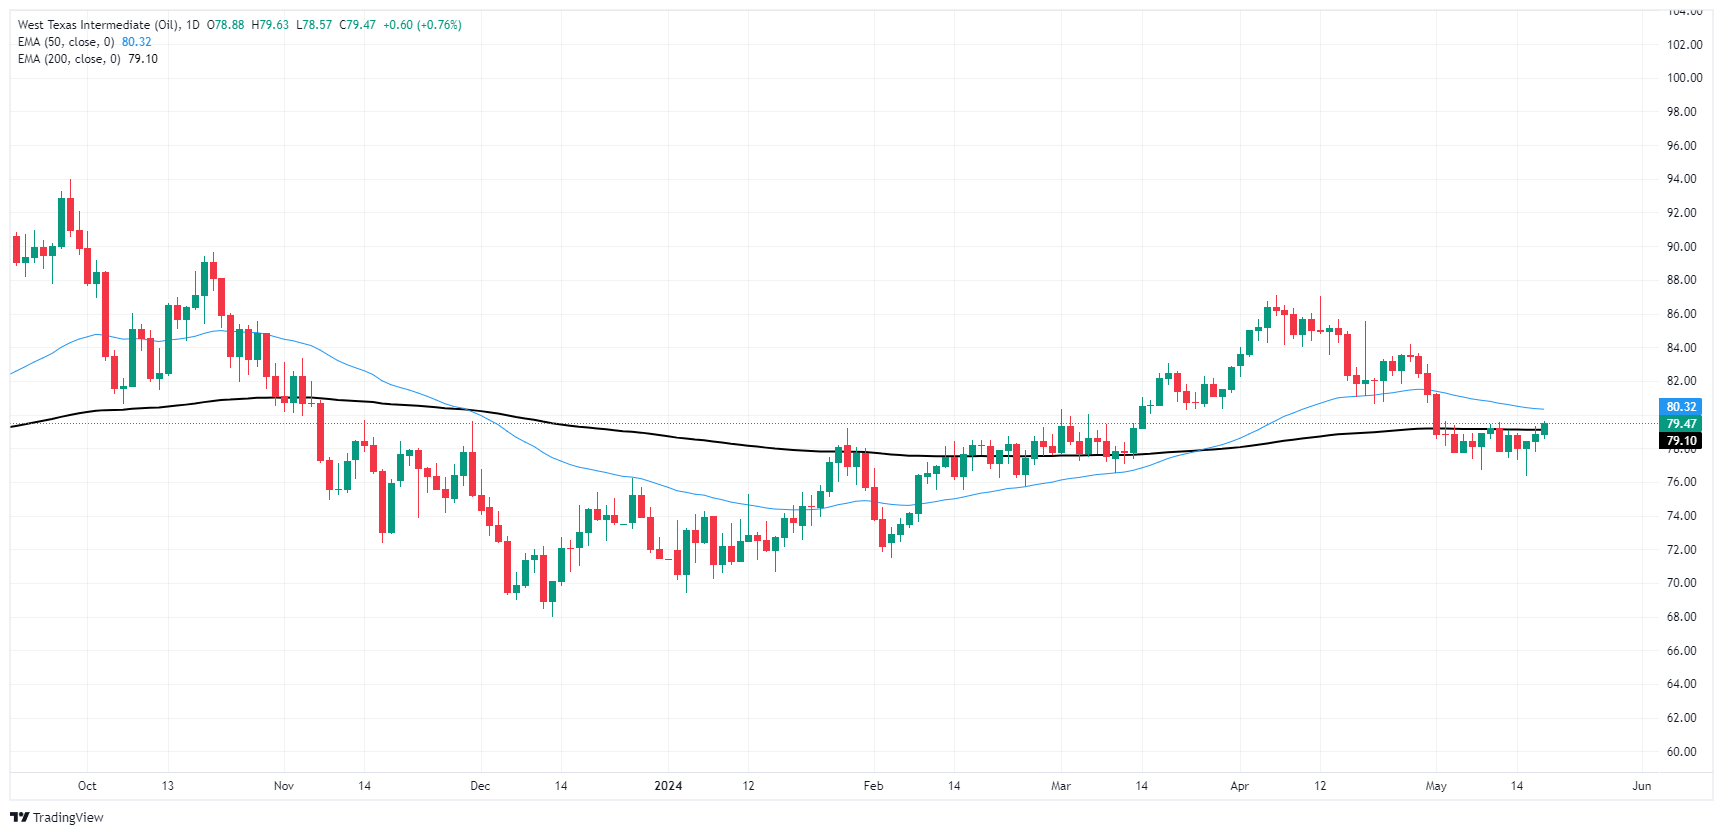
US Crude Oil rose into a late weekly high on Friday, pushing through the 200-day Exponential Moving Average (EMA) at 79.10, ticking into 79.63 before the closing bell. WTI is pushing into a consolidation zone between the 50-day and 200-day EMAs.
The near-term ceiling is priced in at the last swing high near 87.00, but US Crude Oil is still up over 10% in 2024 despite trading down from the year’s early peaks.
WTI daily chart
(Click on image to enlarge)
WTI US OIL
| OVERVIEW | |
|---|---|
| Today last price | 79.49 |
| Today Daily Change | 0.61 |
| Today Daily Change % | 0.77 |
| Today daily open | 78.88 |
| TRENDS | |
|---|---|
| Daily SMA20 | 80.14 |
| Daily SMA50 | 81.52 |
| Daily SMA100 | 78.36 |
| Daily SMA200 | 79.67 |
| LEVELS | |
|---|---|
| Previous Daily High | 79.3 |
| Previous Daily Low | 77.75 |
| Previous Weekly High | 79.56 |
| Previous Weekly Low | 76.71 |
| Previous Monthly High | 87.12 |
| Previous Monthly Low | 80.62 |
| Daily Fibonacci 38.2% | 78.71 |
| Daily Fibonacci 61.8% | 78.34 |
| Daily Pivot Point S1 | 77.98 |
| Daily Pivot Point S2 | 77.09 |
| Daily Pivot Point S3 | 76.44 |
| Daily Pivot Point R1 | 79.53 |
| Daily Pivot Point R2 | 80.19 |
| Daily Pivot Point R3 | 81.08 |
More By This Author:
EUR/USD Slipped On Thursday After Greenback Pares Some LossesEUR/USD Reaches For 1.0900, Easing US CPI Inflation Pummels Greenback
Dow Jones Industrial Average Shrugs Off Declining Consumer Sentiment, Climbs 125 Points On Friday


Comments
Log in or sign up to join the conversation.