WTI Price Analysis: Sticks To Modest Gains Around Mid-$82.00s, Upside Potential Seems Limited
West Texas Intermediate (WTI) Crude Oil prices attract some buying on Tuesday and move away from a near three-week low, around the $81.55 region touched the previous day. The commodity sticks to its modest intraday gains through the first half of the European session and currently trades around mid-$82.00s, up 0.25% for the day.
Worries that a further escalation in the Israel-Hamas conflict could disrupt oil supplies from the Middle East turn out to be a key factor lending some support to the black liquid. The upside, however, remains capped in the wake of the worsening economic conditions in China – the world's top oil importer – and headwinds stemming from rapidly rising borrowing costs, which could dent fuel demand.
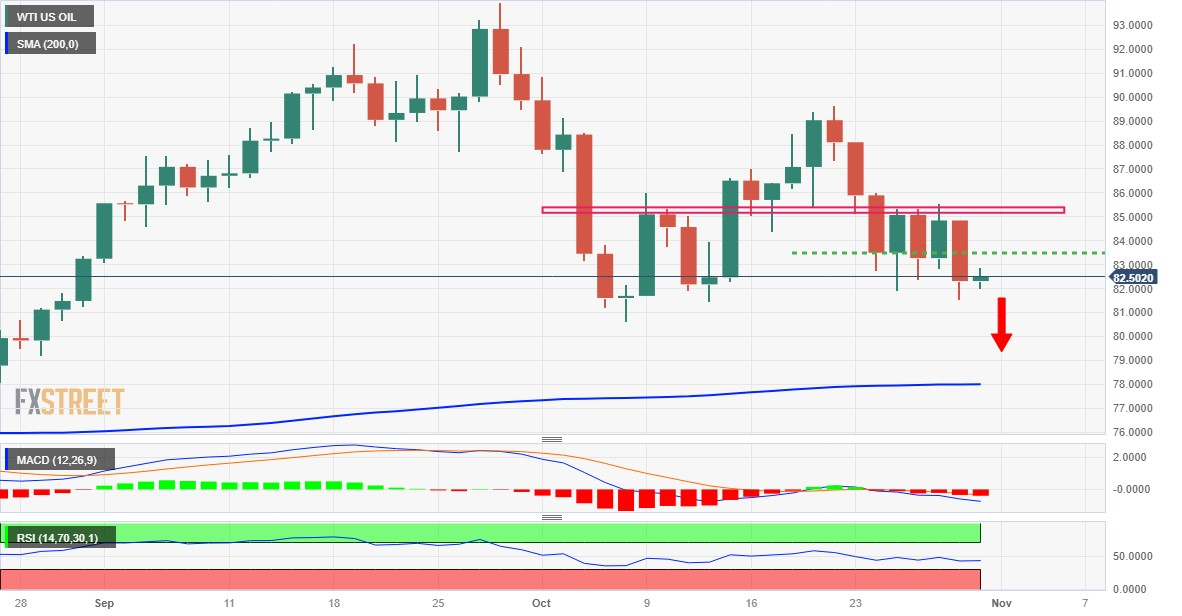
From a technical perspective, the overnight sharp decline and a close below the $83.50-$83.30 horizontal support could be seen as a fresh trigger for bearish traders. Moreover, oscillators on the daily chart have just started drifting into the negative territory and suggest that the path of least resistance for Oil prices is to the downside. Hence, any subsequent move up is more likely to get sold into.
The $83.00 round figure, followed by the $83.30-$83.50 support breakpoint now seems to act as an immediate strong barrier. A sustained strength beyond, however, could lift Oil prices beyond the $84.00 mark, towards the $84.70 intermediate hurdle en route to the $85.00 psychological mark. The next relevant resistance is pegged near the mid-$85.00s, which if cleared will negate the bearish outlook.
On the flip side, the $82.00 round figure is likely to protect the immediate downside ahead of the overnight swing low, around the $81.55 region. Some follow-through selling will be seen as a fresh trigger for bearish traders and make Oil prices vulnerable to weaken further below the $81.00 mark. The downward trajectory could eventually drag the commodity towards the monthly low, around the $80.65 region.
WTI daily chart
(Click on image to enlarge)
Technical levels to watch
WTI US OIL
| OVERVIEW | |
|---|---|
| Today last price | 82.52 |
| Today Daily Change | 0.21 |
| Today Daily Change % | 0.26 |
| Today daily open | 82.31 |
| TRENDS | |
|---|---|
| Daily SMA20 | 84.86 |
| Daily SMA50 | 85.84 |
| Daily SMA100 | 80.85 |
| Daily SMA200 | 77.99 |
| LEVELS | |
|---|---|
| Previous Daily High | 84.85 |
| Previous Daily Low | 81.55 |
| Previous Weekly High | 88.12 |
| Previous Weekly Low | 81.91 |
| Previous Monthly High | 93.98 |
| Previous Monthly Low | 83.09 |
| Daily Fibonacci 38.2% | 82.81 |
| Daily Fibonacci 61.8% | 83.59 |
| Daily Pivot Point S1 | 80.96 |
| Daily Pivot Point S2 | 79.6 |
| Daily Pivot Point S3 | 77.66 |
| Daily Pivot Point R1 | 84.26 |
| Daily Pivot Point R2 | 86.2 |
| Daily Pivot Point R3 | 87.56 |
More By This Author:
NZD/USD Moves Below 0.5850 As Greenback Rebounds, Awaits Fed DecisionAUD/JPY Price Analysis: Remains Subdued Around 94.50/95.00, Amid Lack Of Catalyst
EUR/JPY Remains Under Pressure Below The 158.00 Mark, German GDP, CPI Eyed
Disclosure: Information on this article contains forward-looking statements that involve risks and uncertainties. Markets and instruments profiled on this page are for informational purposes ...
more


