
Western Texas Intermediate (WTI), the US crude oil benchmark, tumbled more than 3% on Wednesday as risk aversion surfaced, following Fitch’s downgrading US credit rating from AAA to AA+. Furthermore, a drop in US stockpiles weighed on oil prices. WTI is trading at $79.44 per barrel, down 3.24% after hitting a daily high of $82.39.
WTI’s price falls sharply as risk aversion surfaces
Fitch’s revision to US Government debt from AAA to AA+ was blamed “on a perceived deterioration in US governance, which it said gave less confidence in the government’s ability to address fiscal and debt issues,” according to sources cited by Reuters. That said, Wall Street plunged, while most US Dollar denominated commodities, like precious metals and oil, drifted lower.
The US Energy Information Administration (EIA) revealed that stockpiles dropped by 17 million barrels, the largest fall in US crude oil inventories, according to records from 1982. Increased refinery runs and strong US crude exports spurred stockpiles to dip.
In the meantime, weaker PMIs revealed in China showed that factory activity fell for the fourth month in a row in July, suggesting China’s demand for oil would continue to dent as the economic recovery slowdown.
Market players anticipate Saudi Arabia to extend its 1 million barrels per day (bpd) crude output for another month, including September, in a meeting of oil producers on Friday.
WTI Price Analysis: Technical outlook
(Click on image to enlarge)
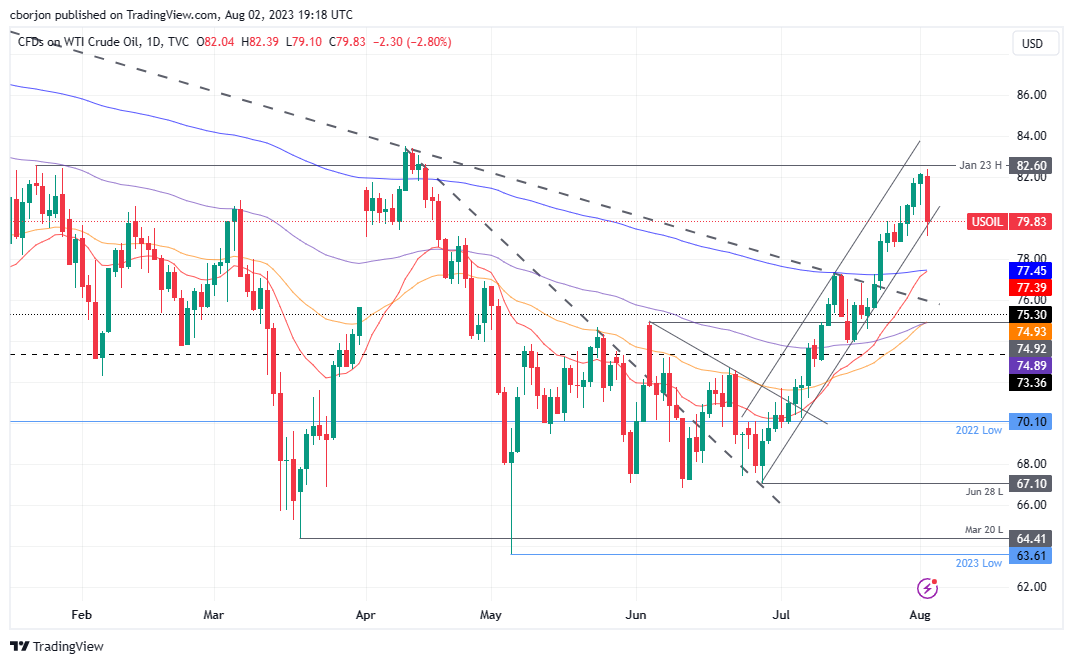
WTI is trading within the bottom boundaries of an ascending channel, which witnessed the US crude oil benchmark advance from around $67.10 above $82.00 per barrel. However, as sentiment turns negative, WTI is extending its losses past $80.00 a barrel, threatening to extend its losses toward the intersection of the 200 and 20-day EMAs, each at $77.45 and $77.37, respectively. If that area is cleared, WTI’s next stop would be the confluence of the 50 and 100-day EMAs, at $74.91 and $74.88. On the other hand, if WTI stays above $80.00, that could pave the way for a recovery toward higher prices.
WTI US OIL
| OVERVIEW | |
|---|---|
| Today last price | 79.65 |
| Today Daily Change | -2.29 |
| Today Daily Change % | -2.79 |
| Today daily open | 81.94 |
| TRENDS | |
|---|---|
| Daily SMA20 | 76.56 |
| Daily SMA50 | 73.01 |
| Daily SMA100 | 73.7 |
| Daily SMA200 | 76.51 |
| LEVELS | |
|---|---|
| Previous Daily High | 81.98 |
| Previous Daily Low | 80.4 |
| Previous Weekly High | 80.54 |
| Previous Weekly Low | 76.38 |
| Previous Monthly High | 81.78 |
| Previous Monthly Low | 69.77 |
| Daily Fibonacci 38.2% | 81.37 |
| Daily Fibonacci 61.8% | 81 |
| Daily Pivot Point S1 | 80.9 |
| Daily Pivot Point S2 | 79.86 |
| Daily Pivot Point S3 | 79.32 |
| Daily Pivot Point R1 | 82.48 |
| Daily Pivot Point R2 | 83.02 |
| Daily Pivot Point R3 | 84.06 |
More By This Author:
GBP/USD Dives To Multi-Week Lows Amid USD Strength, Eyes On BoE
USD/CAD Breaks Above Key 1.3250, Tests 1.3300
NIO Stock Forecast: NIO Holds Above $15 After Excellent July Delivery Data


Comments
Log in or sign up to join the conversation.