
WTI Crude Oil Trading Flat After Post-weekend Surge, Testing $85
West Texas Intermediary (WTI) Crude Oil prices jumped on Monday after the long-running Gaza Strip conflict between Israel and Palestinian Hamas saw its largest escalation in over fifteen years. WTI barrels are trading near $85.00/bbl after the jump, from last week's lows near $80.60.
While Israel and Hamas are not major players in the oil scene, investors are concerned that geopolitics will spill over into neighboring Iran and Saudi Arabia, and a spreading conflict in the region could also threaten the stability of the Strait of Hormuz, a critical oil supply route that sees nearly a fifth of global oil distribution.
Iran, a public supporter of Hamas, has so far denied any connection or involvement in the Gaza conflict escalation, but market unease remains high about the possibility of further Iranian sanctions from the US, a supporter of Israel.
US politicians are doing little to assuage energy investor fears, with US Senator Lindsey Graham noting on Monday that the US should threaten Iranian oil infrastructure, stating that "If there is an escalation in this conflict, if hostages start getting killed, if Hezbollah in the north attacks Israel in strength, we should tell the Ayatollah we will destroy your oil refineries and your oil infrastructure." Oil barrel traders will be keeping a close eye on any rhetoric escalations from the US.
The US eased Iranian oil restrictions back in August as crude oil supplies drastically undershoot global demand, drawing down US oil reserves into record lows.
Keeping oil prices from spiraling out of control is slumping global demand for crude barrels and a massive overhang in gasoline reserves after refiners capitalized on recent spikes in crude prices, and investors will be looking out for further stimulus programs from China, which could re-ignite demand for oil, further constraining supply lines.
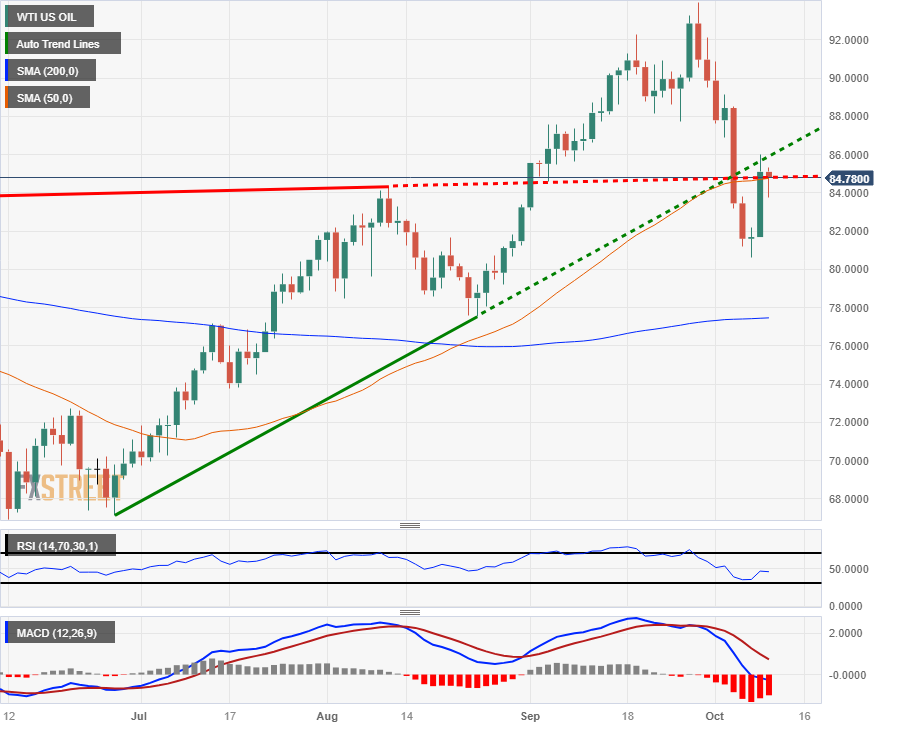
WTI Technical Outlook
WTI Crude Oil barrels climbed over 5.5% on Monday, and are currently splashing around near $85.00/bbl. Despite Monday's spike, WTI remains firmly lower from the recent peak of $93.98.
The recent chart decline in WTI barrel costs saw US oil prices tumble below a rising trendline from the June low of $67.14, and prices are currently hung up on the 50-day Simple Moving Average (SMA), with technical support coming from the 200-day SMA just south of the $78.00 handle.
WTI Daily Chart
WTI Technical Levels
WTI US OIL
| OVERVIEW | |
|---|---|
| Today last price | 84.62 |
| Today Daily Change | -0.48 |
| Today Daily Change % | -0.56 |
| Today daily open | 85.1 |
| TRENDS | |
|---|---|
| Daily SMA20 | 88.41 |
| Daily SMA50 | 84.71 |
| Daily SMA100 | 78.78 |
| Daily SMA200 | 77.45 |
| LEVELS | |
|---|---|
| Previous Daily High | 86.01 |
| Previous Daily Low | 81.69 |
| Previous Weekly High | 90.88 |
| Previous Weekly Low | 80.63 |
| Previous Monthly High | 93.98 |
| Previous Monthly Low | 83.09 |
| Daily Fibonacci 38.2% | 84.36 |
| Daily Fibonacci 61.8% | 83.34 |
| Daily Pivot Point S1 | 82.52 |
| Daily Pivot Point S2 | 79.95 |
| Daily Pivot Point S3 | 78.21 |
| Daily Pivot Point R1 | 86.84 |
| Daily Pivot Point R2 | 88.59 |
| Daily Pivot Point R3 | 91.16 |
More By This Author:
USD/JPY Oscillates At Around 148.60 Amidst Dovish Fed Remarks, Risk-On ImpulsePalantir Stock Forecast: Plantir Advances On $250 Million US Army Contract
NZD/USD Price Analysis: Remains Below Two-Week High Amid Modest USD Strength
Disclosure: Information on this article contains forward-looking statements that involve risks and uncertainties. Markets and instruments profiled on this page are for informational purposes ...
more

