
WTI Crude Oil Tests Critical Support Zone: Can Oil Bulls Hold The Lows?
WTI CRUDE OIL PRICE ACTION TALKING POINTS:
- WTI crude oil prices have fallen by as much as 21.8% in the month of January.
- Oil bulls were in-control to start the year, but that quickly changed.
- WTI crude oil is now testing a critical zone of support that held three tests last year.
WTI CRUDE OIL FALLS TO CRITICAL SUPPORT ZONE
It’s been a brutal month in crude oil markets as a series of drivers have pushed prices down to a fresh three-month-low. It didn’t start that way, however, as a quick rush of fear shortly after the New Year open pushed WTI crude oil prices up to a fresh eight-month-high, with a fast move above the $65 level. This was driven by fears of heightened tensions between the US and Iran which could, of course, bring on supply disruptions. But as tensions calmed and cooler heads prevailed, Oil prices gave back those gains and then some; only for another bearish driver to take over after-the-fact.
This driver is one that may stay in the headlines for a while and given the importance of global dynamics for oil prices, this could potentially keep pressure on the offer. The growing fear around Coronavirus hasn’t really been offset yet and the situation continues to develop. The more fear that shows around this theme, the less people will be able to freely travel or even trade between countries, and that can further depress demand for oil.
At this point, WTI crude oil is testing a critical support zone that held the lows throughout last year’s trade. This zone is a confluent area of Fibonacci levels that runs from 50.54 up to 51.68; the former level is the 23.6% retracement of the Q4 2018 sell-off while the latter level is the 61.8% retracement of the recovery move from that prior bearish theme. This zone held three separate support tests last year, the last of which was in October before buyers came back to push into the end of the year.
WTI CRUDE OIL DAILY PRICE CHART: RETURN TO KEY SUPPORT
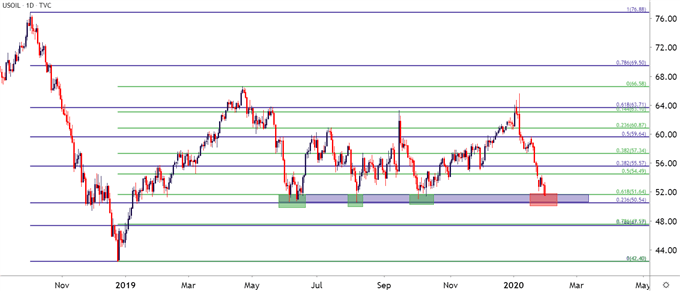
Chart prepared by James Stanley; Crude Oil on Tradingview
CAN SELLERS BREACH THE 50-HANDLE? AND IF SO, WHERE TO NEXT?
Support is unlikely to hold up forever but, at this point, the quandary as to whether this current test will hold or not comes down to matter of force and how aggressively sellers might continue to push. Prior instances of support in this region have often been coupled with supply cuts or other verbiage from interested parties that helped to tilt the supply/demand equation back into the favor of oil bulls. But, for this test, those same actors may not have the same firepower as the current bearish run is emblematic of a fear-based scenario that, as yet, doesn’t have an answer or even much clarity.
On a longer-term basis and something that I’ve often discussed in webinars, time does not appear to be on the side of bulls in Oil. Similar to the shorter-term layout, there’s a level of support lurking below current price action that’s held three separate tests: This takes place around the 42-level, and this was the same price that helped to arrest that Q4 2018 sell-off. A breach of the 50-handle opens the door for another test down around the 42-handle.
On the way down to that three-year-low around 42, a potential stopping point for the move could appear around 47.50, where exists a bit of Fibonacci confluence.
WTI CRUDE OIL WEEKLY PRICE CHART
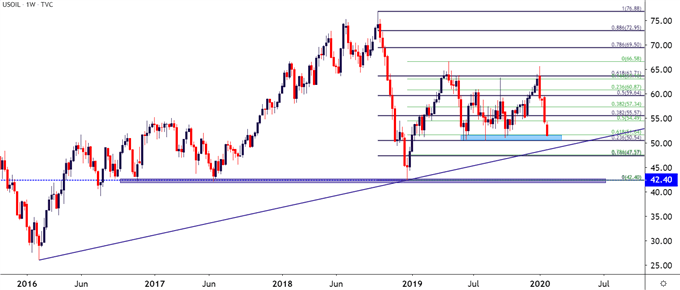
Chart prepared by James Stanley; Crude Oil on Tradingview


