

Image Source: Pixabay
- WTI Crude Oil falls over 2% amid tariff threats and rising trade tensions.
- President Trump threatens additional sanctions against Russia, with a 50-day deadline for peace talks with Ukraine.
- WTI nears psychological support at $66.00 with triangle resistance firming at $68.00.
WTI Crude Oil is falling sharply on Monday, as escalating trade disputes and warnings against Russia weigh on sentiment.
At the time of writing, West Texas Intermediate (WTI) has lost over 2% of its recent gains, with the price nearing $66.00.
Over the weekend, US President Donald Trump threatened a 30% blanket tariff on imports from the European Union and Mexico, scheduled to take effect on August 1.
These measures have revived concerns over slowing global trade and energy demand.
In a separate development, President Trump delivered a warning to Russia during a joint press briefing with NATO Secretary-General Mark Rutte in the Oval Office on Monday.
Trump announced a 50-day deadline for Russia to reach a ceasefire agreement with Ukraine. Should Moscow fail to comply, he vowed that the United States would impose "very severe secondary tariffs," including a 100% levy on Russian goods.
“We’re going to be doing very severe tariffs if we don’t have a deal in 50 days — tariffs at about 100 percent, you’d call them secondary,” Trump said. “It’s great for settling wars.”
These remarks, covered by Bloomberg, add to the complex geopolitical landscape already influencing Oil markets.
The WTI Crude Oil daily chart shows that prices have recently pulled back after failing to hold above the 200-day Simple Moving Average (SMA) resistance of $68.00.
Price action is currently trading above the psychological support level of $66.14, with the 50% Fibonacci retracement level of the January-April decline providing resistance at $67.08.
The 50-day and 100-day SMAs are providing additional support at $64.59 and $64.87, respectively. Price action is coiling within a symmetrical triangle, indicating a buildup for a potential breakout.
WTI Crude Oil daily chart
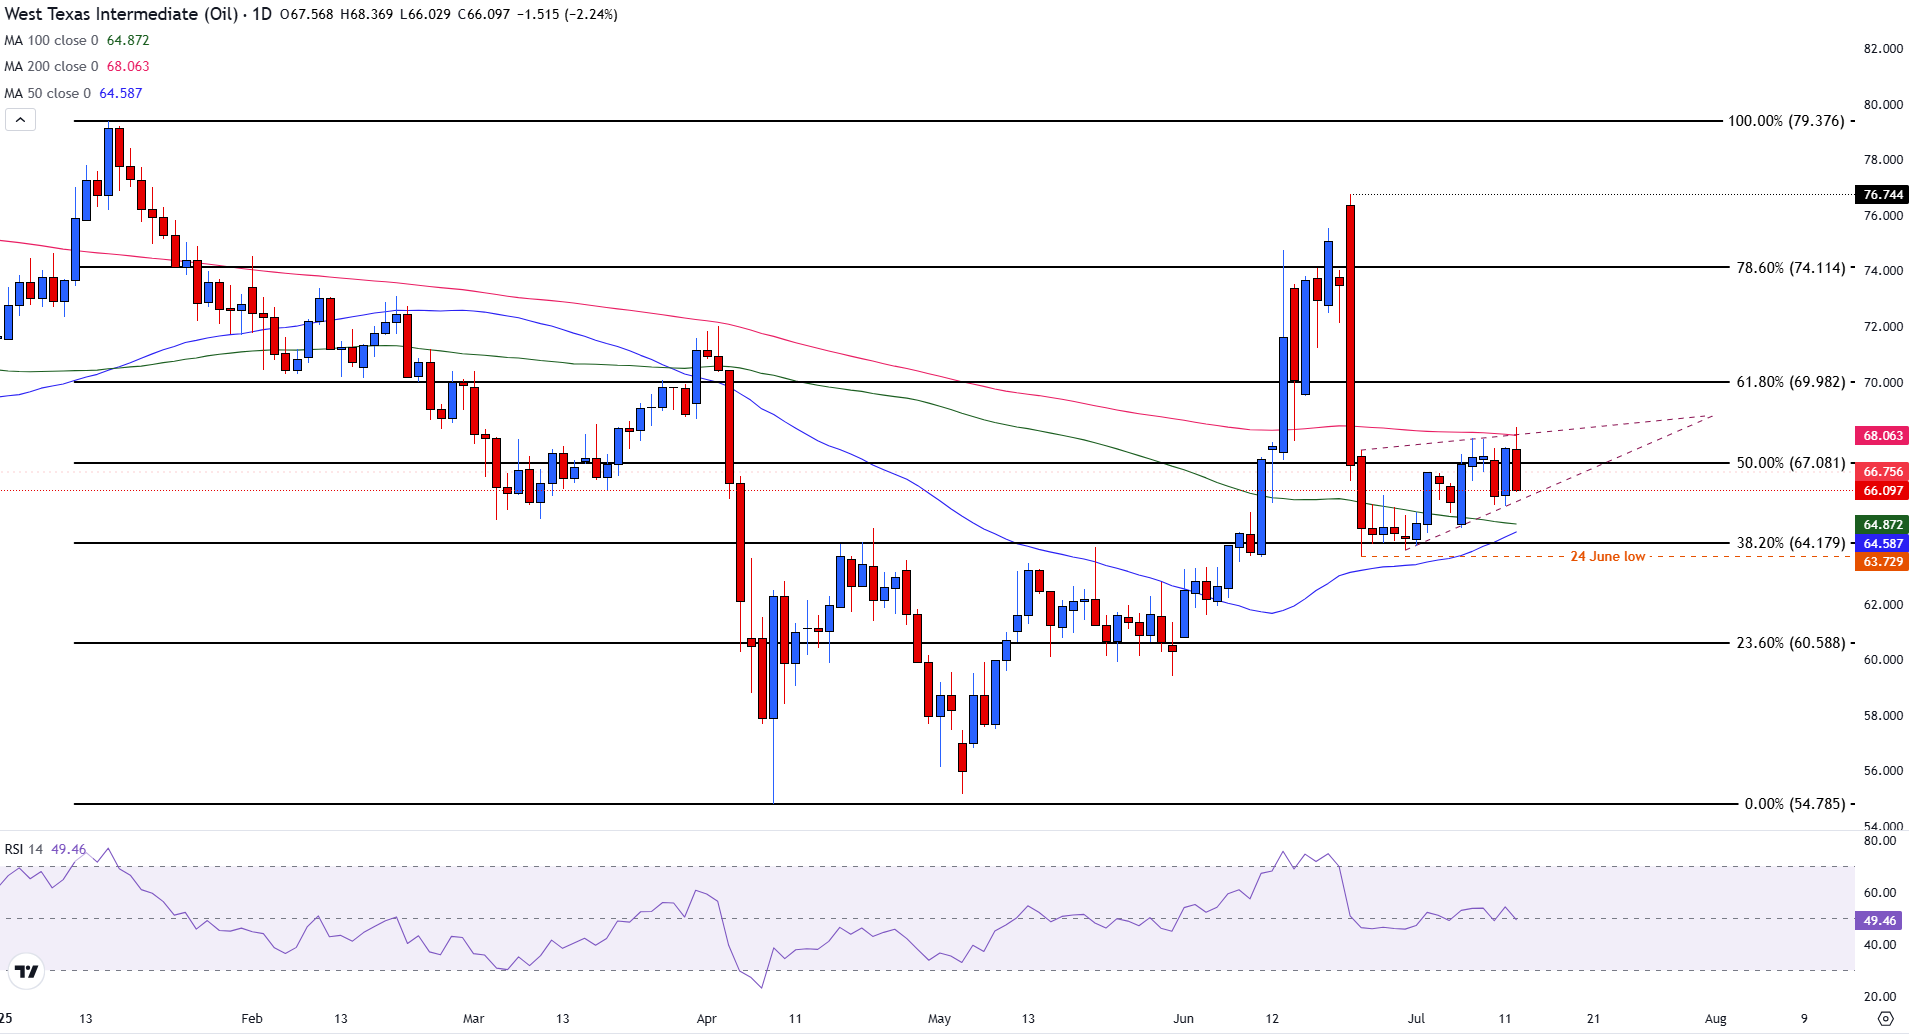
However, the Relative Strength Index (RSI) is neutral near 50, showing a lack of momentum in either direction.
A decisive move below the triangle could expose the June 24 low at $63.73.
On the other hand, a break above $67.08 and the 200-day SMA at $68.06 would be needed to shift the bias back to bullish. For now, the setup leans neutral with a slight bearish tilt following the recent rejection.
More By This Author:
Copper Prices Steady As Refining Constraints And Tariff Fears PersistWTI Stabilizes Above $67 As EIA cuts U.S. Output Forecast, Geopolitical Risks Persist
Gold Spikes As Safe-Haven Demand Surges On Trump's Tariff Threats

Comments
Log in or sign up to join the conversation.