WTI Climbs On Geopolitical Tension Amid Supply Disruptions Concerns
Image Source: Unsplash
The US Crude Oil benchmark, also known as West Texas Intermediate (WTI), has risen more than 2% on geopolitical risks as a militant group linked to Iran continues to attack ships around the Red Sea. This has triggered a rally in WTI, exchanging hands at $73.82 due to Oil supply disruption.
WTI surges as a militant group linked to Iran continues attacks on ships in the Red Sea
Crude Oil prices extended their rally to four straight days, bolstered by a weaker US Dollar (USD) after the US Federal Reserve (Fed) ended its tightening cycle, hinting that rate cuts lie ahead in 2024. Nevertheless, an attack on Norwegian-owned vessels and Oil shipping firms avoiding the Red Sea is already impacting Oil prices.
Sources cited by Reuters said, “The rise in geopolitical risk premium, which has come in the form of regular hostilities towards commercial vessels in the Red Sea by Iran-backed Houthi rebels, plays its indisputable part in Oil's resurrection.”
Around 15% of world shipping traffic passes via the Suez Canal, the shortest shipping route between Europe and Asia.
Meanwhile, an increase in supply cushioned WTI’s rise on Monday, but Russia and Saudi Arabia, extending Crude Oil production cuts to the first quarter of 2024, are underpinning Oil prices.
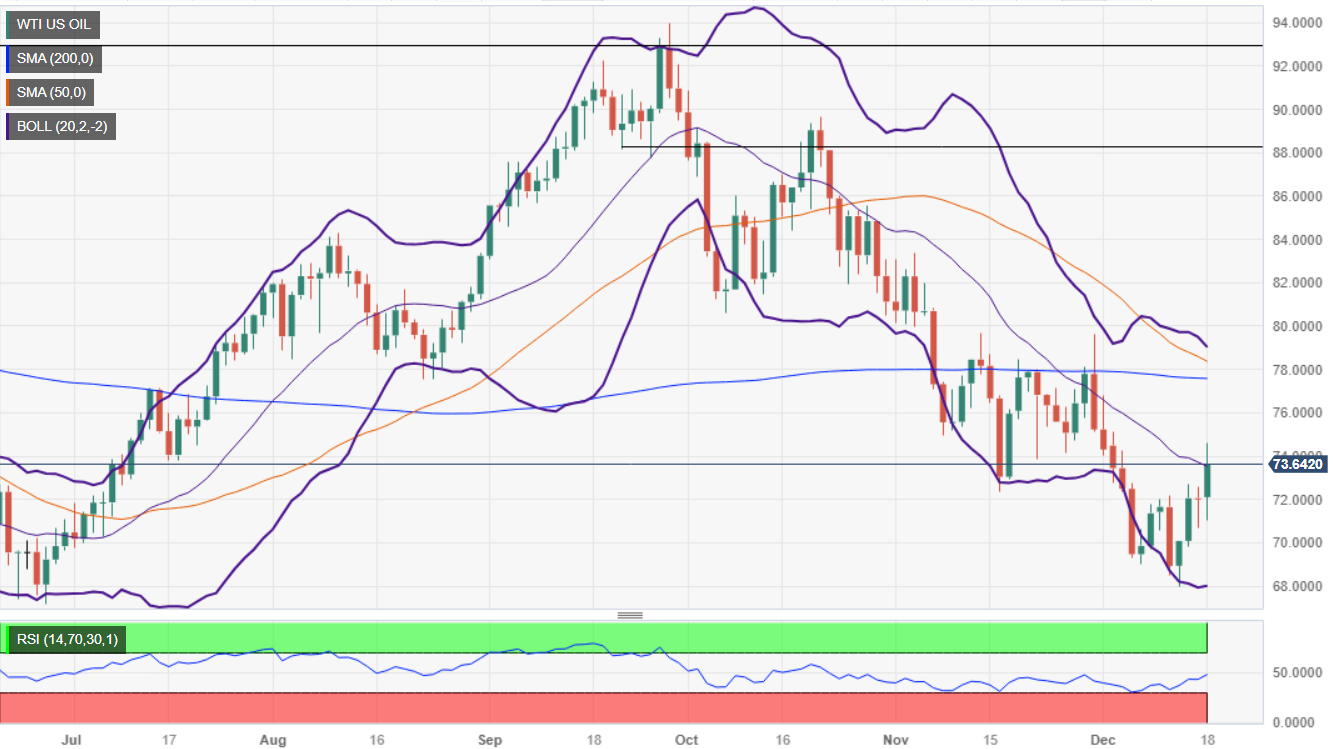
WTI’s outlook remains uncertain due to the recent developments, but due to the location of daily moving averages (DMAs) above WTi’s price, could open the door for further losses. Otherwise, further escalation in the Middle East area, could lift prices and dent inflation progress worldwide.
WTI Price Analysis: Technical outlook
The daily chart portrays WTI as neutral to downward biased, but today’s jump would pave the way for a new trading range within the $72.22-$76.00 area, ahead of testing the 200-day moving average (DMA) at $77.72. On the other hand, achieving a daily close below November’s 16 latest cycle low of $72.22 could open the door to a dip to the $70.00 mark, followed by December’s swing low of $67.74.
(Click on image to enlarge)

WTI US OIL
| OVERVIEW | |
|---|---|
| Today last price | 73.72 |
| Today Daily Change | 1.71 |
| Today Daily Change % | 2.37 |
| Today daily open | 72.01 |
| TRENDS | |
|---|---|
| Daily SMA20 | 73.72 |
| Daily SMA50 | 78.6 |
| Daily SMA100 | 81.62 |
| Daily SMA200 | 77.6 |
| LEVELS | |
|---|---|
| Previous Daily High | 72.56 |
| Previous Daily Low | 70.66 |
| Previous Weekly High | 72.73 |
| Previous Weekly Low | 67.97 |
| Previous Monthly High | 83.34 |
| Previous Monthly Low | 72.39 |
| Daily Fibonacci 38.2% | 71.39 |
| Daily Fibonacci 61.8% | 71.83 |
| Daily Pivot Point S1 | 70.92 |
| Daily Pivot Point S2 | 69.84 |
| Daily Pivot Point S3 | 69.02 |
| Daily Pivot Point R1 | 72.83 |
| Daily Pivot Point R2 | 73.65 |
| Daily Pivot Point R3 | 74.73 |
More By This Author:
GBP/USD Remains Limited Below 1.2700 Ahead Of UK CPI Data
Euro Loses Strength As Eurozone Data Cast Doubt On ECB Hawkishness
Gold Price Forecast: Loses Ground To $2,020, US Housing Data Eyed
Disclosure: Information on this article contains forward-looking statements that involve risks and uncertainties. Markets and instruments profiled on this page are for informational purposes ...
more


