
While the S&P 500 and the Nasdaq Composite suffered drawdowns of 2.14% and 2.55%, respectively, on Aug. 22, the PMs held up relatively well. For example, gold declined by 0.82%, silver by 1%, the GDX ETF rose by 0.08% and the GDXJ ETF fell by 0.45%. However, the USD Index rallied by 0.82% and U.S. Treasury yields also sought higher ground. As such, the price action across asset classes largely met our expectations.
Awaiting Jackson Hole
With Fed Chairman Jerome Powell scheduled to speak at the annual Jackson Hole symposium on Aug. 26, the financial markets were in front-run mode on Aug. 22. Moreover, while the S&P 500 suffered mightily, the risk-off sentiment was less bearish than it seemed, as high beta assets like Bitcoin have relatively behaved.
However, the GDXJ ETF closed at another monthly low, which enhanced the profits from our short position; and with the EUR/USD hitting a new 2022 low, the FX market signals more downside for the S&P 500 and the PMs over the medium term.
Please see below:
(Click on image to enlarge)
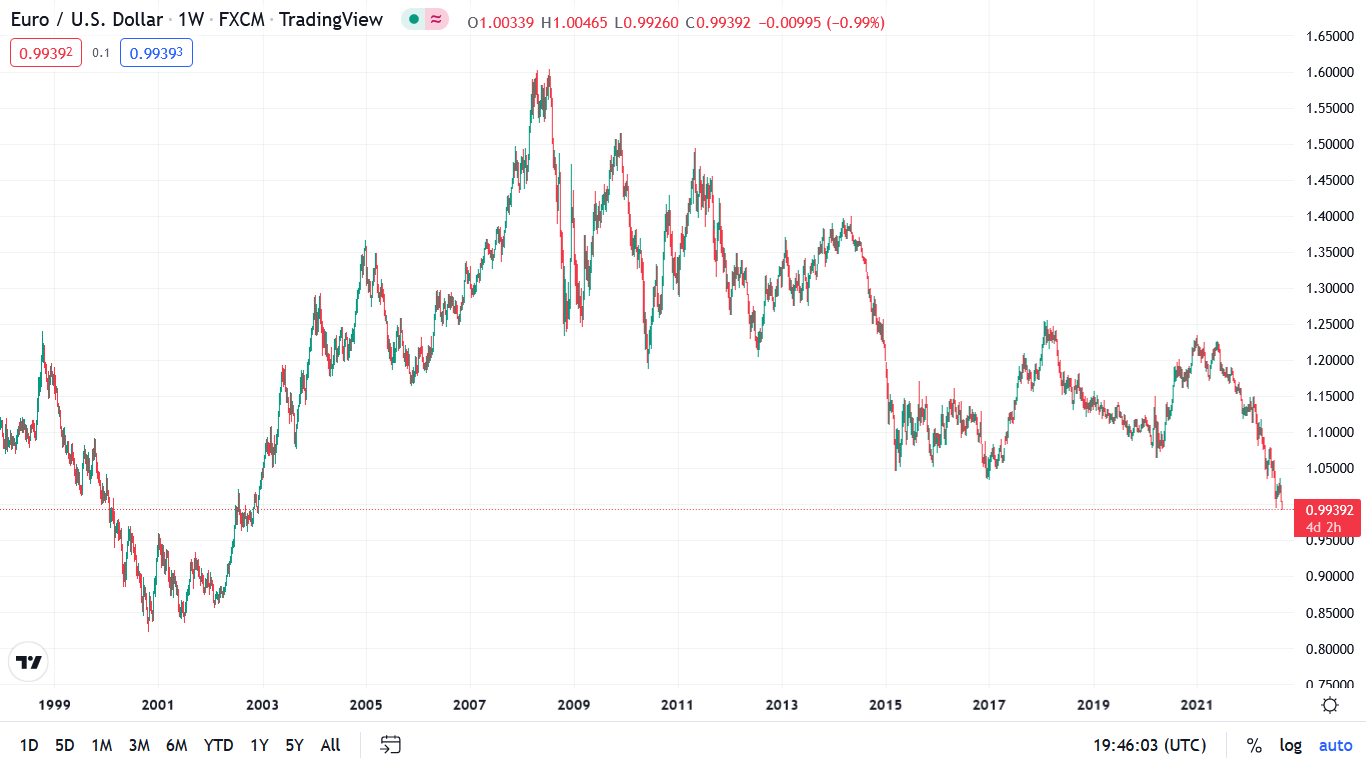
To explain, the candlesticks above track the EUR/USD. As you can see, the currency pair is stuck at a ~20-year low. Furthermore, I warned repeatedly that the U.S. dollar was headed higher and the euro would be a material laggard. I wrote on Oct. 20, 2021:
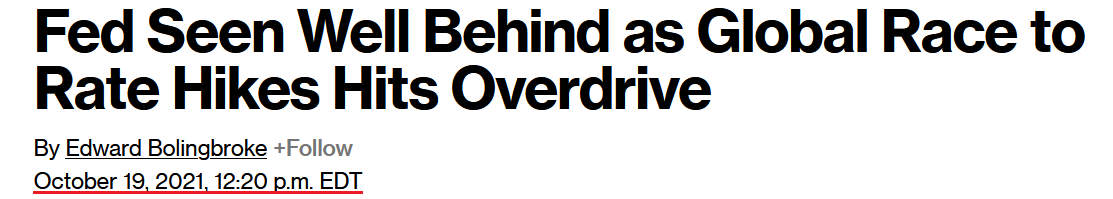
While market sentiment implies that the USD Index’s best days are in the rearview, the ‘new narrative’ couldn’t be further from the truth. To explain, Bloomberg published the following article on Oct. 19:
(…) The bottom line? While headlines have turned on the U.S. dollar, the greenback’s fundamentals remain robust. The ECB and the BoJ are more dovish than the Fed (the EUR/USD and the USD/JPY are the most important currency pairs within the USD Index) and the BoC still hasn’t made any major moves. Likewise, with rising U.S. Treasury yields also supportive of a stronger U.S. dollar, the greenback should continue its uptrend once reality re-emerges.
Thus, while the crowd understands now that the Fed is no longer “well behind” and is instead leading the pack, the euro’s drop to new 2022 lows delivered a profound fundamental message. Therefore, while stocks basically suffered a token sell-off on Aug. 22, investors still don’t appreciate the fundamental headwinds on the horizon.
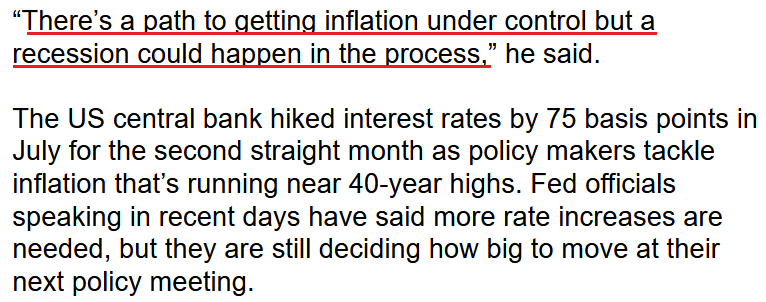
To that point, while the bulls plea for a dovish pivot, the realities of unanchored inflation make the current setup nothing like the post-GFC environment. Moreover, Richmond Fed President Thomas Barkin said on Aug. 19:
“We’re committed to returning inflation to our 2% target and we’ll do what it takes to get there (…). Getting inflation under control is going to be necessary to set up what we have the potential to do in the economy. I’ve convinced myself that not getting inflation under control is inconsistent with a thriving economy.”
As a result, while I’ve warned on numerous occasions that the biggest risk to the U.S. economy is not raising interest rates, Barkin understands that a rate-hike-induced recession is preferable to a hyperinflationary collapse.
Please see below:
Source: Bloomberg
Furthermore, reality reminds us that the Fed hasn't successfully curbed unanchored inflation without triggering a recession since 1954. Thus, with data from Bank of America showing that the S&P 500 has only priced in a 20% chance of a recession, the expectations imbalance leaves plenty of room for further downside. I wrote on Aug. 22:
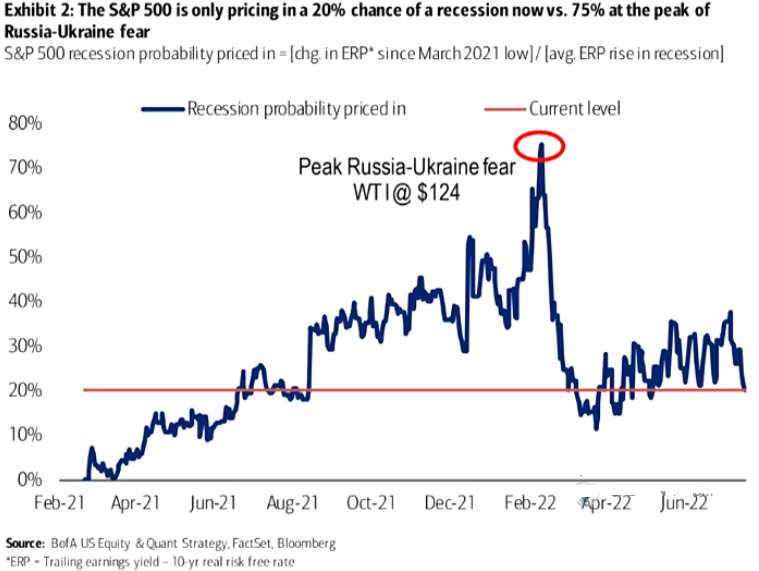
To explain, the blue line above tracks the recession odds priced into the S&P 500. For context, Bank of America forecasts the metric by dividing the change in the equity risk premium (ERP) since March 2021 by the average change in the ERP during historical recessions. If you analyze the high in early 2022, peak fear had investors pricing in a 75% chance of recession. Yet now, the metric stands at 20%.
In addition, while the Nasdaq 100 has declined by 4.6% from its Aug. 18 close, the post-GFC crowd is still following its outdated playbook.
Please see below:
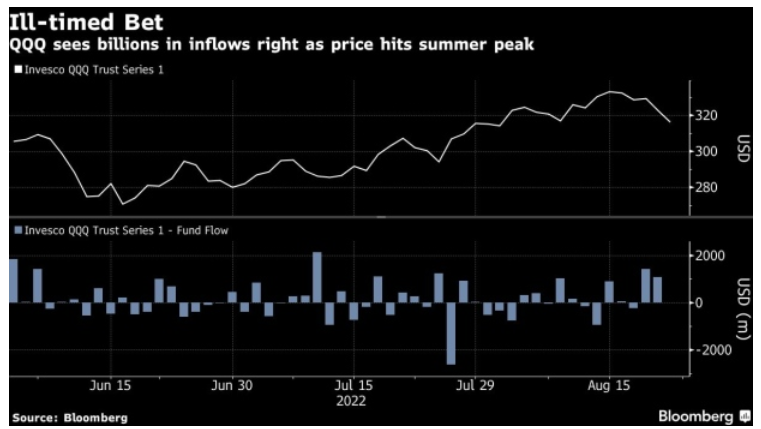
To explain, the white line above tracks the Invesco QQQ ETF (which replicates the Nasdaq 100), while the blue bars at the bottom track fund flows. If you analyze the right side of the chart, the two positive blue bars highlight how investors poured money into the ETF as the FOMO rally approached its precipice. As a result, while the consensus opines that “everyone is bearish,” actions speak louder than words.
The Bloomberg article stated:
“Investors piled about $3.2 billion into the Invesco QQQ Trust Series 1 ETF (ticker QQQ) last week, the biggest weekly inflow since December, only to see the fund snap a four-week winning streak, ending down 2.3%.
“QQQ’s rally from its June lows, stoked by the market’s expectations for a pivot to slower rate hikes, is fizzling after Federal Reserve policymakers warned that interest rates are going higher and investors brace for more hawkish commentary at the upcoming Jackson Hole meeting.”
On top of that, financial conditions remain relatively loose, and Powell will only create more inflationary problems if he repeats his blunder from Jul. 27.
Please see below:
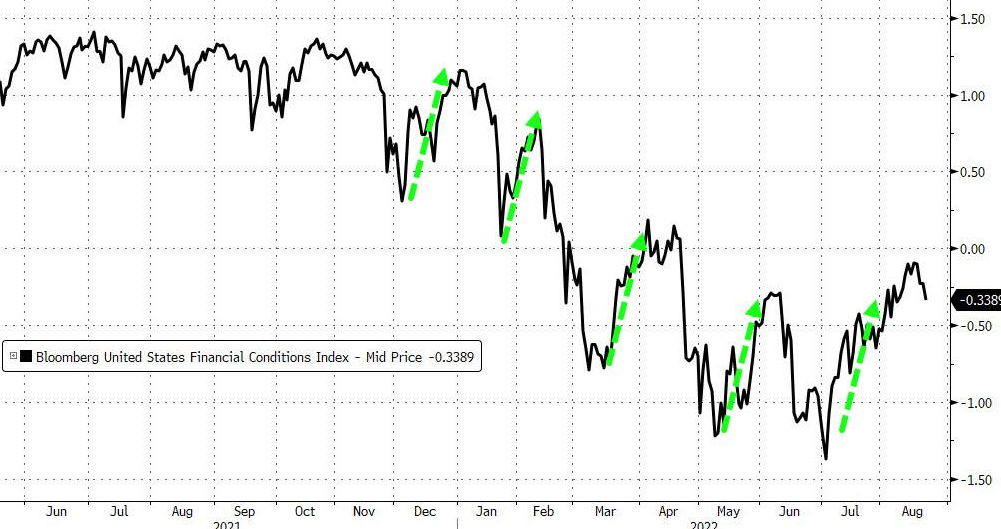
Source: Bloomberg/ZeroHedge
To explain, the black line above tracks the Bloomberg Financial Conditions Index (FCI). For context, when the black line falls, financial conditions tighten, and when it rises, financial conditions loosen. If you analyze the green arrows, you can see that each time investors attempted to stage risk-on rallies, Fed officials had to hammer home their hawkish message. As such, the metric has made lower highs and lower lows.
Furthermore, while stocks have declined modestly, Treasury yields have risen, and high yield credit spreads have bounced off their lows, the U.S. dollar is the only FCI component at or near its 2022 high. Therefore, the black line’s turn on the right side of the chart has only erased a small portion of the loosening that unfolded in July.
Thus, Powell needs to push the black line closer to its lows to alleviate inflation, which implies material tightening and more pressure on asset prices.
Likewise, while Powell needs to say this at Jackson Hole to avoid another round of ambiguity, the rate market aligns with the FX market (hawkish and long USD), and the S&P 500 and the PMs’ prices are still far from reflecting these fundamental developments.
Please see below:
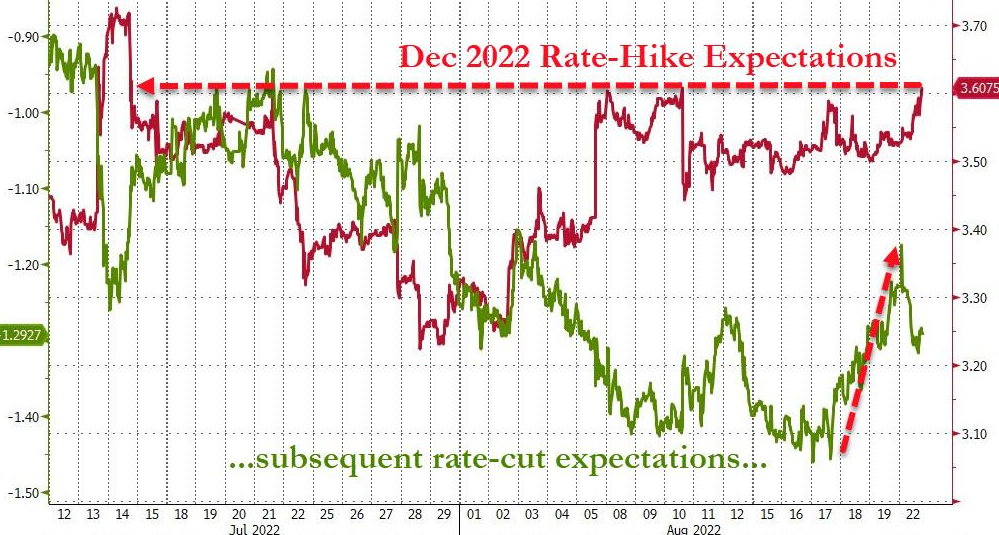
Source: Bloomberg/ZeroHedge
To explain, the red line above tracks the consensus December 2022 rate hike expectations, while the green line above tracks the inverted (down means up) rate cut expectations. If you analyze the movement of the former, you can see that the futures market is back to pricing in a more hawkish Fed path. Likewise, the rising green line shows how rate-cut expectations have moved off their highs.
Therefore, while we expect these metrics to become even more hawkish (4.5%+ fed funds rate in 2023), I warned on Aug. 12 that investors’ expectations were in fantasy land. I wrote:
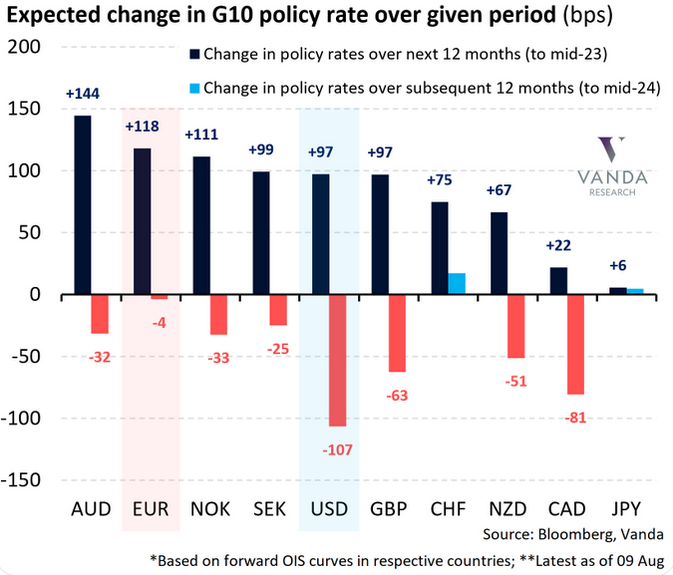
If you analyze the USD column, you can see that “peak inflation” has investors pricing in 97 basis points of rate increases over the next 12 months and 107 basis points of rate cuts from mid-2023 to mid-2024. Therefore, the consensus expects the U.S. dollar to be a relative underperformer as other central banks play catch-up.
To that point, the EUR column shows that investors expect 118 basis points of rate increases over the next 12 months and 4 basis points of rate cuts from mid-2023 to mid-2024. Thus, the expectations are bullish for the EUR/USD, which accounts for nearly 58% of the USD Index’s movement.
However, investors’ rate hike/cut expectations are in la-la land. The idea that the ECB will out-hawk the Fed by hiking more and cutting less contrasts fundamental reality. Furthermore, the Eurozone is in much worse economic shape than the U.S., and the EUR/USD should continue its descent when investors realize this.
All in all, with the U.S. dollar rallying, the euro falling, and investors’ U.S. rate hike expectations ratcheting higher, we’re back to some semblance of reality. Moreover, with the theme likely to continue in the months ahead, gold, silver, and mining stocks are unlikely to benefit from the pro-USD fundamental environment. As a result, our GDXJ ETF short position has the potential to reap even more profits in the months ahead.
Low Probability, High Impact
With a “tail risk” defined as a rare event that could cause immense damage if realized, investors often use the term to reference potential outcomes that are three standard deviations away from what’s expected. However, the difference between what the consensus expects and what should occur highlights why the S&P 500 and the PMs are likely far from their medium-term lows.
Please see below:
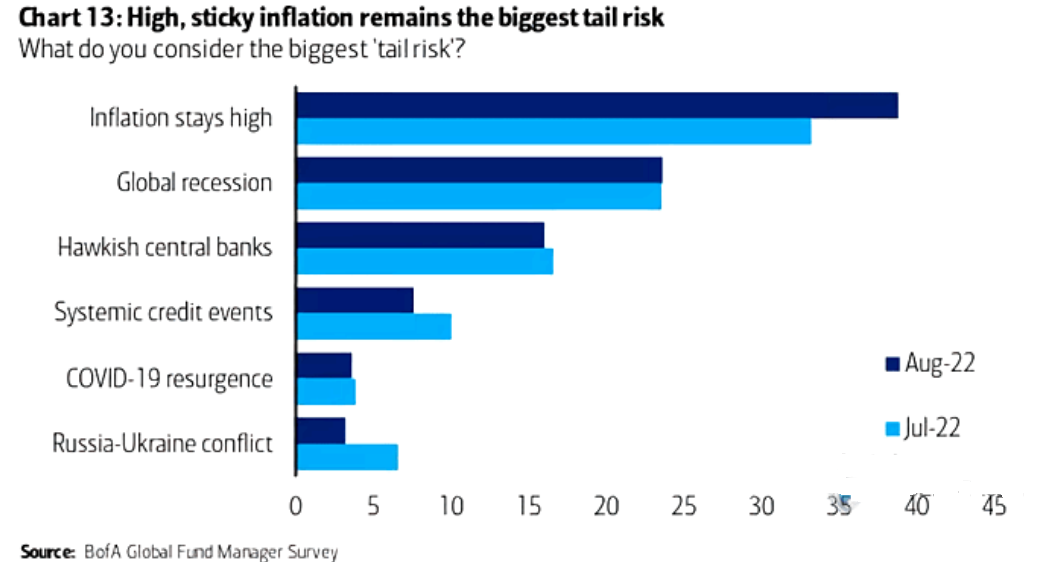
To explain, the dark blue bar above shows how investors’ fears over “sticky inflation” increased in Bank of America’s latest Global Fund Manager Survey. However, what the consensus believes is a tail risk is actually extremely likely to occur.
As evidence, when market participants celebrated the headline Consumer Price Index’s (CPI) deceleration on Aug. 10 – which was due to lower oil & gas prices – I noted on Aug. 11 how the Atlanta Fed’s Sticky CPIs hit new 2022 highs. I wrote:
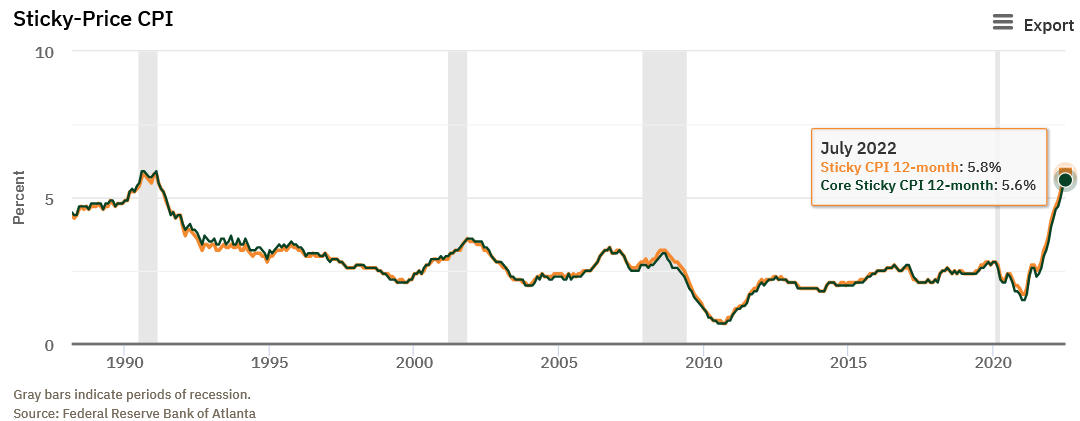
To explain, the orange and green lines above track the YoY percentage changes in the Sticky and core Sticky (excluding food and energy) CPIs. If you analyze the right side of the chart, you can see that neither decelerated in July.
For context, the Atlanta Fed defines the metrics as:
“The Sticky CPI is calculated from a subset of goods and services included in the CPI that change price relatively infrequently. Because these goods and services change price relatively infrequently, they are thought to incorporate expectations about future inflation to a greater degree than prices that change on a more frequent basis.”
Thus, while volatile energy prices made the headline CPI look less fierce on the surface, inflation is broadening and remains embedded in the U.S. economy. As a result, while the recent risk rally was built on the hopes of peak inflation and a dovish pivot, fundamental realities should materially shift sentiment over the medium term.
The Bottom Line
While the USD Index is on fire and real yields are increasing, financial conditions are still looser than in July. Therefore, while the rates and FX markets have done some of Powell’s work for him, he needs to emphasize his hawkish message on Aug. 26 or he’ll risk reversing the progress once again. Furthermore, the Fed still underestimates its inflation fight and the S&P 500 is materially overvalued. As such, a reversal of these imbalances should weigh heavily on the PMs in the months ahead.
In conclusion, the PMs were mixed on Aug. 22, as the GDX ETF closed in the green. However, with gold, silver, and mining stocks’ technical and fundamental outlooks still headed in the wrong directions, lower lows should be on the horizon.
More By This Author:
If The S&P 500 Plunges, The Gold Market May FollowThe USDX Situation Suggests The Peak in Gold Is Already In
Why Is The USDX Weak Lately And Gold Not Responding To It?


Comments
Log in or sign up to join the conversation.