
Will U.S. Dollar Uptrend Slow Foreign Real Estate Investment In The U.S.?
The U.S. Dollar uptrend has been going on since January 6th, 2021:
- U.S. Dollar is at a 14-year high
- 2020-2022 U.S. Presidential Cycle: USD appreciated +18.33% to date
- 2016-2020 U.S. Presidential Cycle: USD depreciated – 12.80%
- 2012-2016 U.S. Presidential Cycle: USD appreciated +37.20%
International investors interested in buying U.S. real estate are having issues as converting their country’s currency into the USD significantly reduces the amount of real estate they can purchase.
According to an article by Patrick Clark of Bloomberg on July 11, 2022, “Across the country, nearly 60,000 homes sales fell through according to an analysis by Redfin Corp.” “That was equal to 15% of transactions that went into a contract that month, the highest share of cancellations since April 2020, when early Covid lockdowns froze the housing market.”
Redfin Nasdaq RDFN, which offers a full-service real estate brokerage discounted service, has suffered a staggering loss of -92.80% in its stock price after putting in its February 2021 high.
D.R. Horton NYSE DHI, America’s largest homebuilder as of January 20, 2022, responsible for 71,292 home closings totaling $21.5 billion in revenue for 2021, has dropped -46.44% from its high.
Other housing-related commodity markets such as copper -38.09% and lumber -70.24% are also signaling a recession.
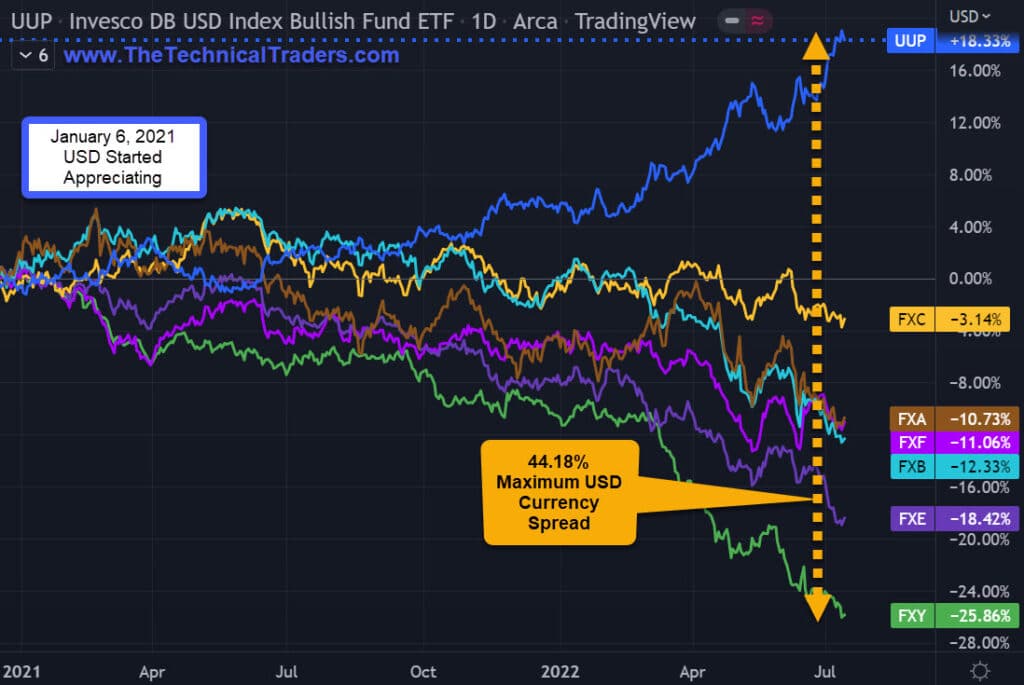
U.S. DOLLAR +18.33%
- UUP +18.33% U.S. Dollar ETF
- FXC -3.14% Canadian Dollar ETF; Spread CAD to the USD 21.47%
- FXA -10.73% Australian Dollar ETF; Spread AUD to the USD 29.06%
- FXF -11.06% Swiss Franc ETF; Spread CHF to the USD 29.39%
- FXB -12.33% British Pound ETF; Spread GBP to the USD 30.66%
- FXE -18.42% Eurodollar ETF; Spread EUD to the USD 36.75%
- FXY -25.86% Japanese Yen ETF; Spread JPY to the USD 44.18%
INVESCO DB USD INDEX BULLISH FUND ETF • UUP • ARCA • DAILY
(Click on image to enlarge)
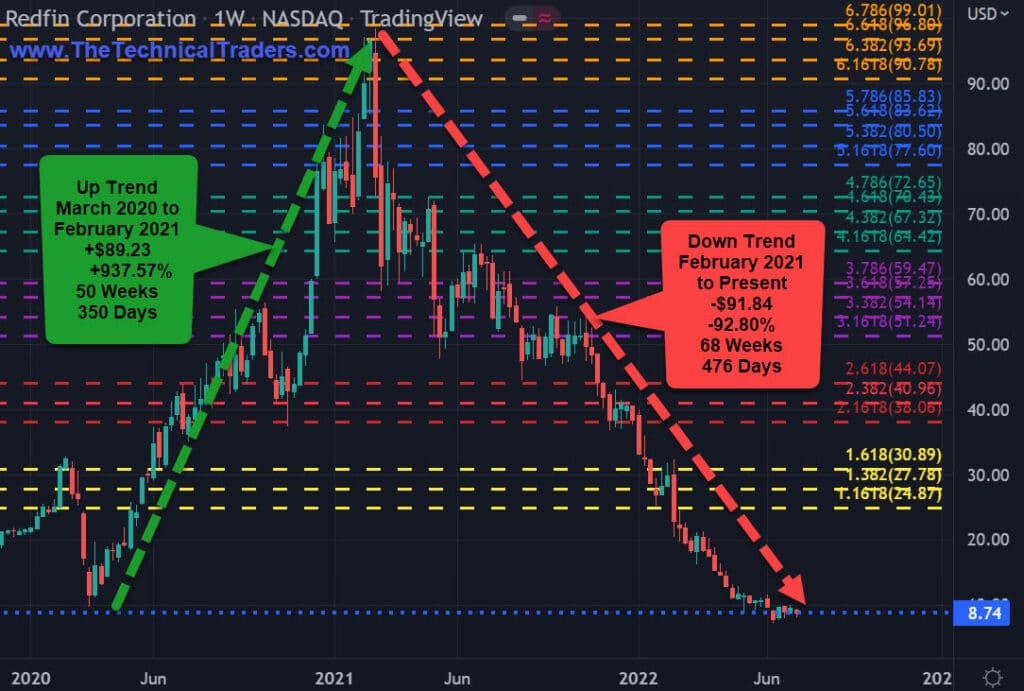
REDFIN -92.80%
- February 2021 to present
- -$91.84 per share or -92.80%
- 68 weeks down; 476 days down
REDFIN CORPORATION • RDFN • NASDAQ • WEEKLY
(Click on image to enlarge)
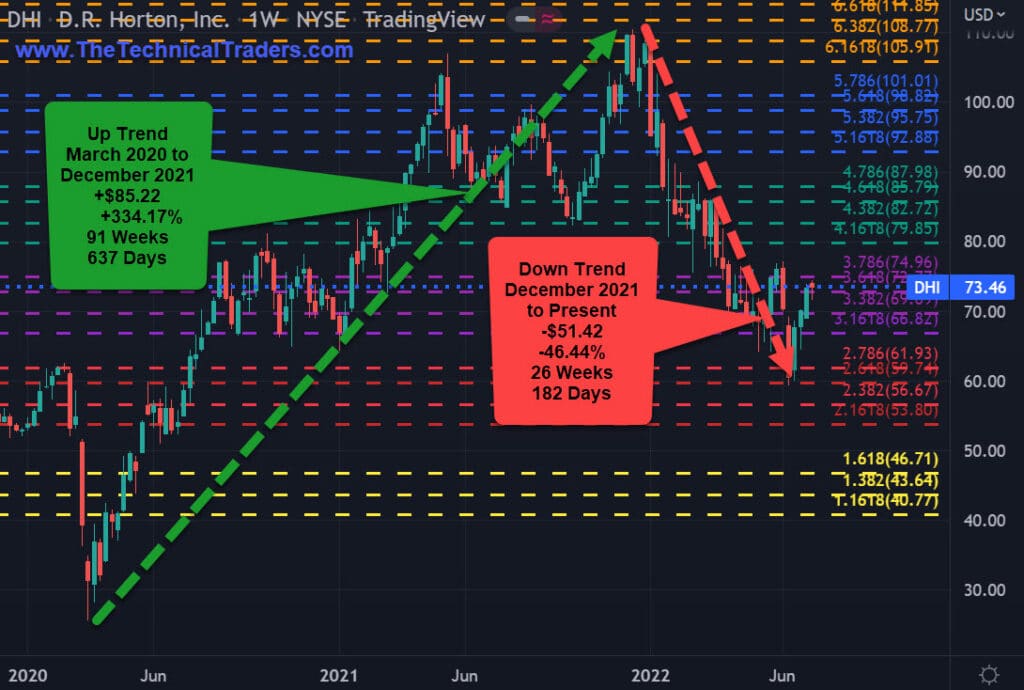
DR HORTON -46.44%
- December 2021 to present
- -$51.42 per share or -46.44%
- 26 weeks down; 182 days down
D.R. HORTON INC. • DHI • NYSE • WEEKLY
(Click on image to enlarge)
COPPER -38.09%
- March 2022 to present
- -$1.91 per pound or -38.09%
- 18 weeks down; 126 days down
CFDS ON COPPER (US$/LB) • XCUUSD • OANDA • WEEKLY
(Click on image to enlarge)

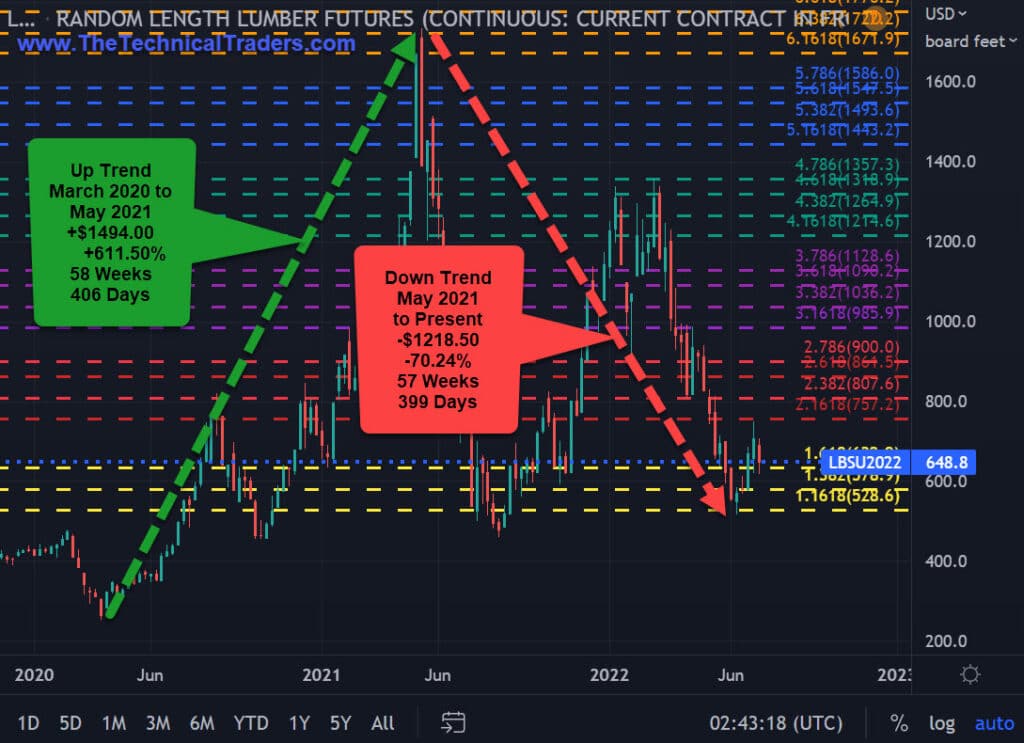
LUMBER -70.24%
- May 2021 to present
- -$1218.50 per board foot or -70.24%
- 57 weeks down; 399 days down
RANDOM LENGTH LUMBER FUTURES (US$/BOARD FOOT) • LBS1 • CME • WEEKLY
(Click on image to enlarge)
More By This Author:
What Are The Driving Forces Behind The Shift In Global Market Risks?Compared To The USD, Auto Company Stocks Are On A Summer Vacation
BIL ETF – Trade Setup Of The Week
Disclosure: If you want to know where the market is headed each day and week, well in advance then be sure to join my Pre-Market Video Forecasting service which is more


