
Will The Guillotine Drop On Gold This Week?
Two things appear to be on the chopping block for this week or are close to being so. The first is the USDX’s corrective downswing, and the second being gold’s short-term rally.
And that can only mean that the precious metals are looking at negative headwinds for the medium-term. How low can the yellow metal go? It may be hard to believe, but is anything below $1500 even possible?
In yesterday’s flagship Gold & Silver Trading Alert, I emphasized that the next short-term top in the precious metals market is likely to be formed this week, most likely on Wednesday or Thursday. The basis for this forecast was the triangle-vertex-based reversal in gold as well as USD’s correction that appears to be analogous to its 2018 correction that was followed by another powerful rally.
In short, the above expectation (and reasoning behind it) remains up-to-date. Let’s start today’s discussion with a look at the USD Index.
USD’s Corrective Downswing is Over
On Friday (Apr. 2), I wrote the following:
What we saw yesterday definitely qualifies as a small correction. In fact, even if it was doubled it would still be small. And – more importantly – it would be in perfect tune with what happened in 2018 during the big rally.
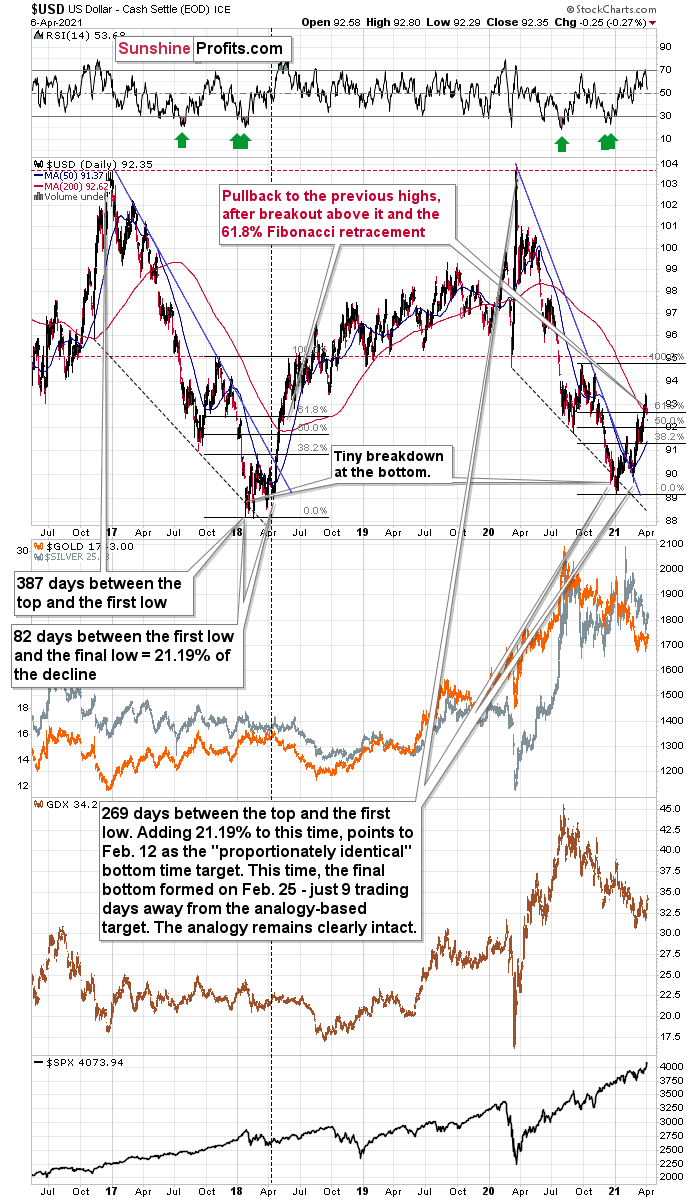
After rallying visibly above the:
- 93 level
- 200-day moving average
- 61.8% Fibonacci retracement level based on the final part of the decline
the USD Index moved back below the 93 level. This happened in May 2018 and it happened last week.
Since both rallies are so similar, it’s nothing odd that we see a pullback in a similar situation.
Back in 2018, the pullback was small and quick. It ended without the USD Index reaching its 200-day moving average. The pullback ended when the USDX moved approximately to its previous high and slightly below the 61.8% Fibonacci retracement.
Applying this to the current situation (previous high at about 92.5, the 61.8% Fibonacci retracement at about 92.7, and the 200-day moving average at 92.66), it seems that the USD Index would be likely to find its bottom in the 92.3 – 92.7 area.
The early-March high was 92.53 in intraday terms, and it was 92.33 in terms of the closing prices. The USD Index moved briefly to 92.29 yesterday (Apr. 6), but it ended the day at 92.35. This means that it moved back to the previous high in terms of the daily closing prices. It also moved below the 61.8% Fibonacci retracement. Consequently, what happened yesterday (and its consequences on the precious metals market) were relatively normal – they didn’t change the outlook.
Unfortunately, unlike the case in early March, this counter-trend rally wasn’t likely enough to happen for us to temporarily switch to a long position. Theoretically, everyone knows that it’s impossible to catch each and every move and correction, and it’s pointless to expect oneself and others to be able to pinpoint each and every move. On the other hand, I realize that it’s unpleasant and disappointing to see such a correction unfold without changing the outlook, so the preferred action is to simply wait while the market moves temporarily against one. It’s difficult, but let’s keep in mind that it’s the kind of “difficult” that every investor and trader chooses when they decide to invest or trade at all – there’s no way to eliminate these “unwelcome” periods in their entirety. What one can do is to focus on the outlook, on proper position size management, and on patience in exercising the actions (or lack thereof) that stem from both the above.
Fortunately, it seems that the corrective downswing in the USD Index is over or almost over now. This – along with the triangle-vertex-based reversal in gold – suggests that the rally in the PMs is over as well, or close to being so.
Gold’s Short-Term Rally is Over
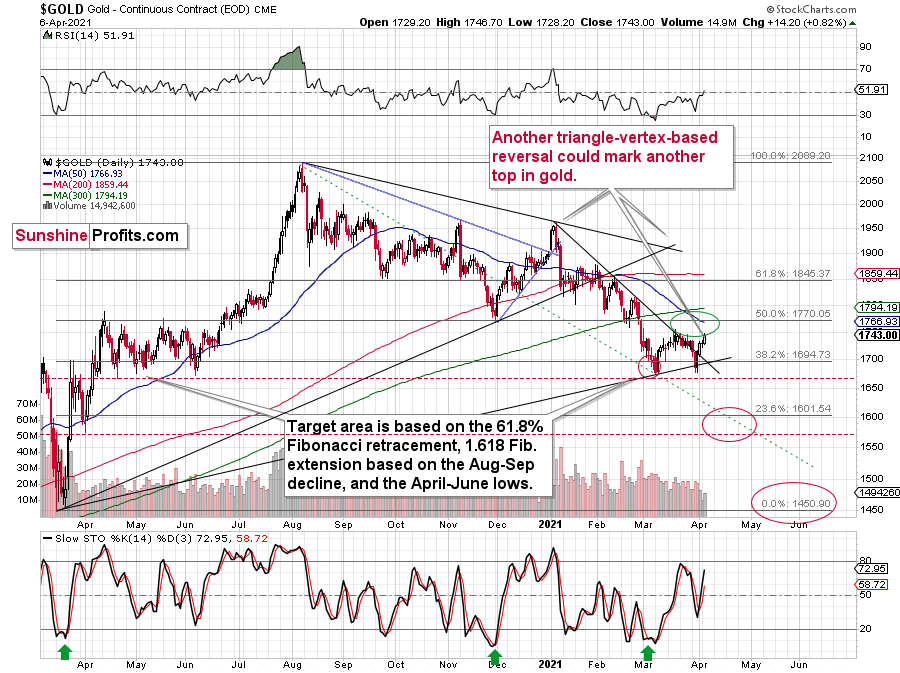
About to meet its maker, the Grim Reaper could surprise the yellow metal this week. With the guillotine likely to drop either today (Apr. 7) or tomorrow (Apr. 8), gold is on a collision course with its triangle-vertex-based reversal point. The chart points to it being “in between” of those two days, so it’s likely to be on either of them or in their close proximity, effectively meaning this week. Moreover, given the yellow metal’s inability to capitalize on the USD Index’s misfortune, the former could already be a dead man walking.
We now know that there is indeed some kind of corrective upswing right now, but the upside target remains exactly as it was previously – we could have seen the top already today, or gold might move slightly higher before topping. The ~$1,770 level seems to be the maximum short-term upside target.
Also, please note that it seems that gold is moving in a way that’s somewhat similar to what we saw between mid-April 2020 and mid-June 2020. It’s trading sideways below $1,800 but above ~$1,660. Back in 2020, the range of the back-and-forth movement (size of the short-term rallies and declines) was bigger, but the preceding move was also more volatile, so it’s normal to expect smaller short-term volatility this year (at least during this consolidation).
Why is this particularly interesting? Because both consolidations (the mid-April 2020 – mid-June 2020 one and the March 2021 – today one) could be the shoulders of a broad head-and-shoulders pattern, where the mid-June 2020 – early-March 2021 performance would be the head. The breakdown below the neck level – at about $1,660 – would be extremely bearish in this case, because the downside target based on the pattern is created based on the size of the head. The target based on this broad pattern would be at about $1,350.
Is this level possible? It is. When gold soared above $2,000, almost nobody thought that it would decline back below its 2011 highs (well, you – my subscribers – did know that). Gold below $1,500 seems unthinkable now, but with rallying long-term rates and soaring USD Index, it could really happen.
I would also like to add that gold moved higher yesterday on volume that was relatively low. The size of the move and the low volume make this action similar to what we saw in early February 2021 – just another relatively small corrective upswing.
Disclaimer: All essays, research, and information found above represent analyses and opinions of Matthew Levy, CFA and Sunshine Profits' associates only. As such, it may prove wrong and be ...
more


Time to say bye bye to gold!