Will Gold's Price Surpass Bitcoin
Even the most cynical members of the gold community may be somewhat stunned by the intensity of the American government’s current meddling in the affairs of almost every nation in the world.
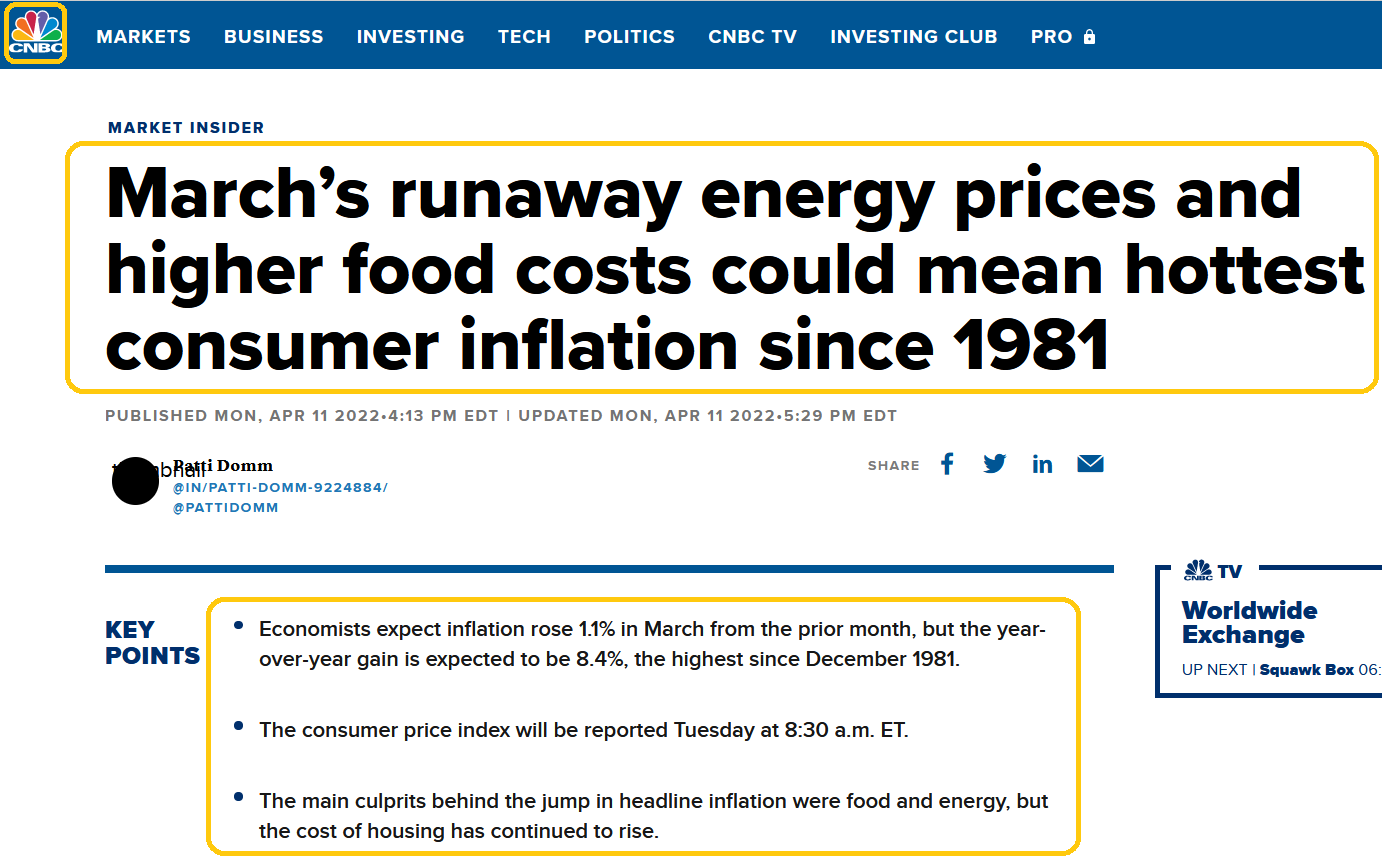
The ability of citizens to pay for minimal food, shelter, medicine, and basic transport is obviously not on the list of “freedoms” that debt-obsessed and war-mongering US politicians are fighting for.
It’s likely only a matter of time before the 2021-2025 war cycle sees major food riots in America, and these riots could involve tens of millions of armed citizens in combat against government stormtroopers… a de facto civil war.
Give the above, gold should be a thousand dollars an ounce higher than where it is now, but America is a fiat nation. Neither political party has made any serious attempt to make gold the money of the nation and the world.
Because of this fact, gold market enthusiasts need to employ hardcore tactics. On that note,
(Click on image to enlarge)
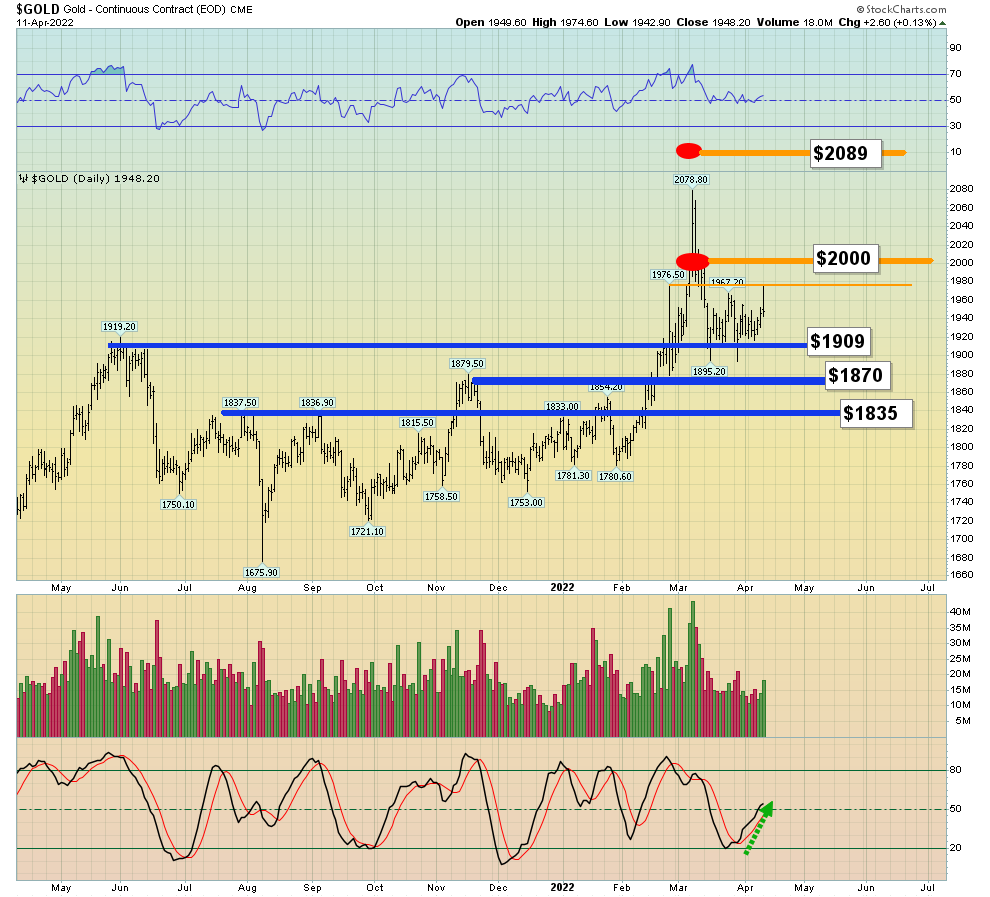
“zones for action” gold chart
The $1965-$1975 area has emerged as a light resistance zone but $2000 and $2089 are where most investors should focus their modest selling.
The $1909, $1870, and $1835 areas are for buying. Investors with no gold can buy right now, and more at my key zones.
(Click on image to enlarge)
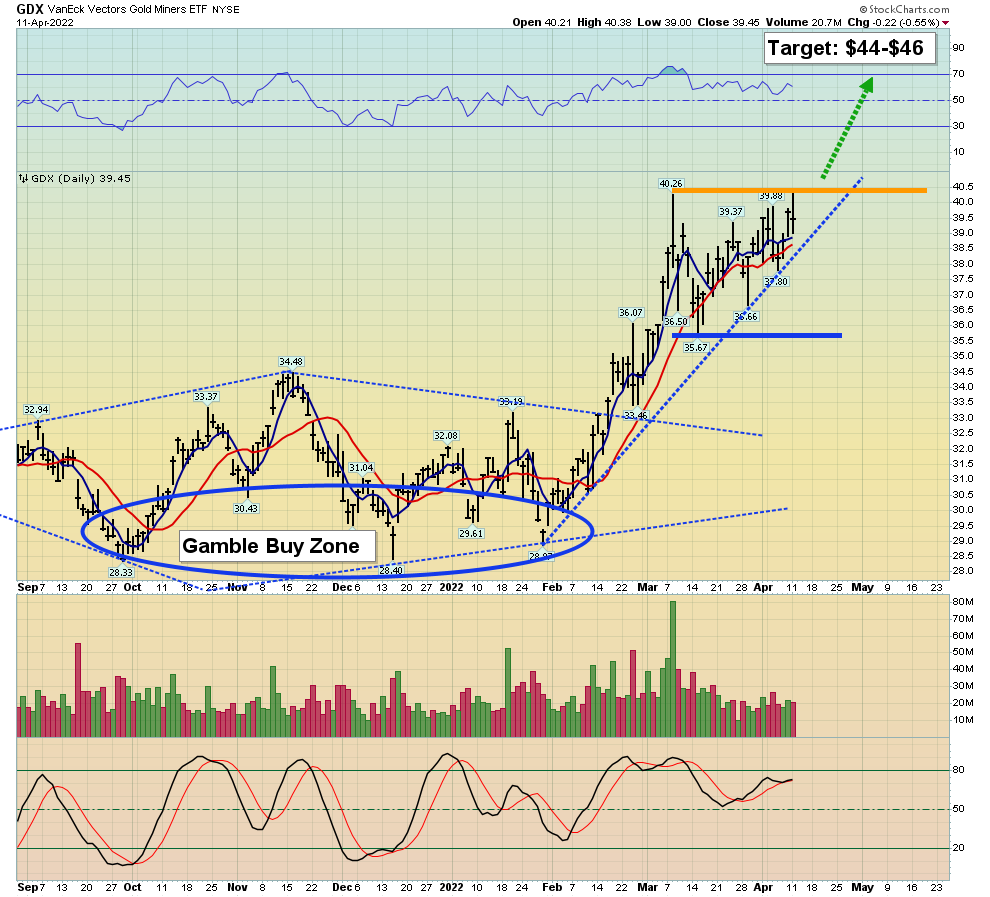
GDX target price chart
A move over $1975 for gold likely brings a solid upside breakout above $40 for GDX.
For now, GDX is consolidating in a $35-$40 range trade. It’s up about 30% in just a few months from my “gamble buy” zone.
That buying area was based on a potential rally from the right side of one of the most bullish chart patterns in the history of markets, the gold bullion H&S/C&H/Quaich pattern on the weekly chart.
The rally happened, and to view the current status of this enormous chart pattern...
(Click on image to enlarge)
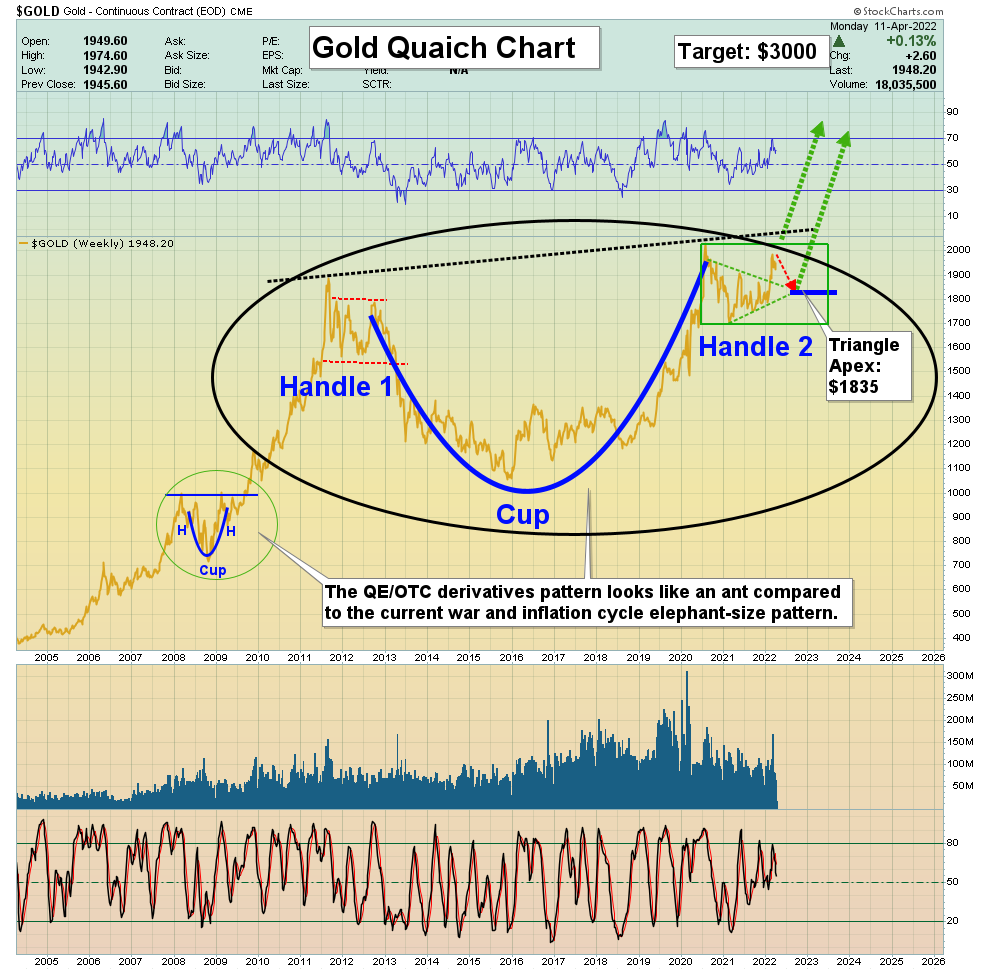
While the pattern is truly majestic, that won’t be the case if an upside breakout doesn’t happen soon.
If too much time passes, the right side of the pattern will lose symmetry with the left, weakening its upside price implications.
Will the pattern weaken? For some insight into the matter...
(Click on image to enlarge)
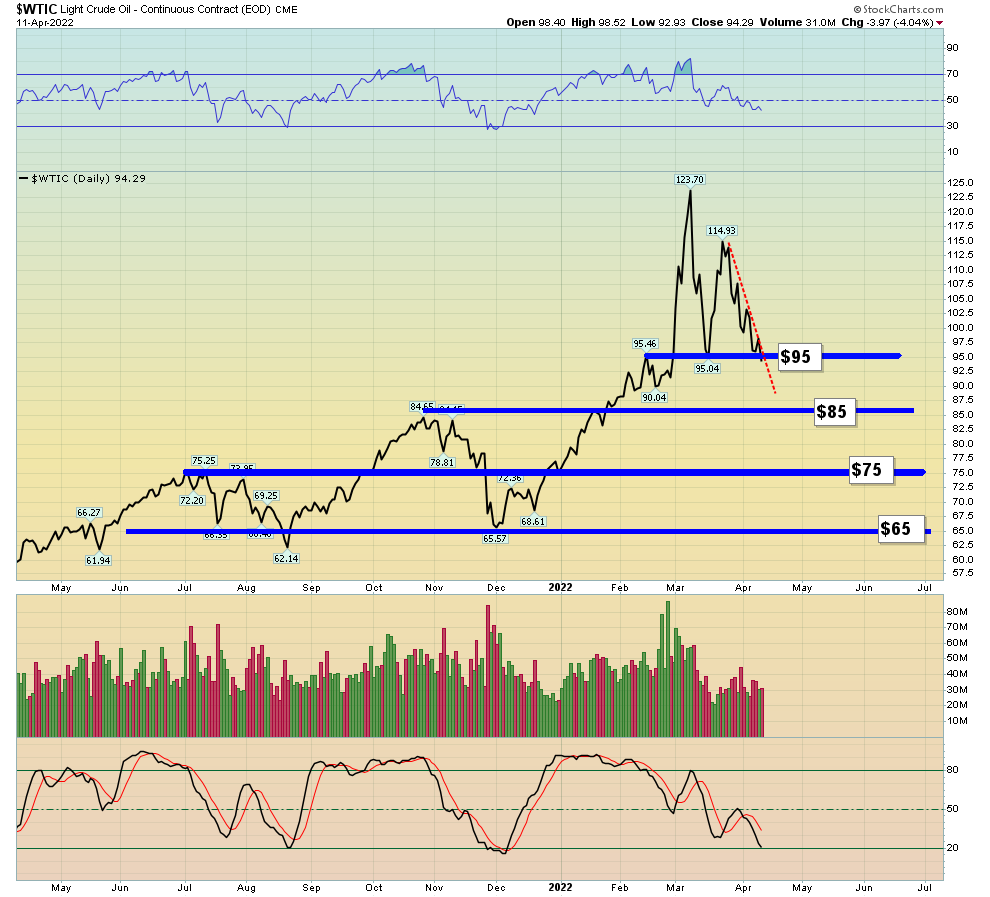
important oil chart
The Chinese government has imposed severe restrictions on businesses and citizens due to a new Coronavirus surge. This is happening at the same time as the US government opens the strategic oil reserve spigots.
This may be why price has suddenly eased from about $130 to $95… and it may be why oil could slip to $85, $75, or even $65 before reversing.
The good news for gold bugs is that “houseflation” and “foodflation” seem unaffected by the drop in demand for oil. Gold can trade higher even if oil and other commodities swoon, due to the US government’s enormous saber-rattling. The future appears to be themed on surprise, and gold thrives in this environment.
What about the stock market? Simply put, a Corona-oriented slowdown in the Chinese economy as the Fed begins rate hikes and QT with the S&P500 CAPE ratio at 36… that’s not what I’d call a fabulous buy signal for the stock market, to put it mildly.
(Click on image to enlarge)
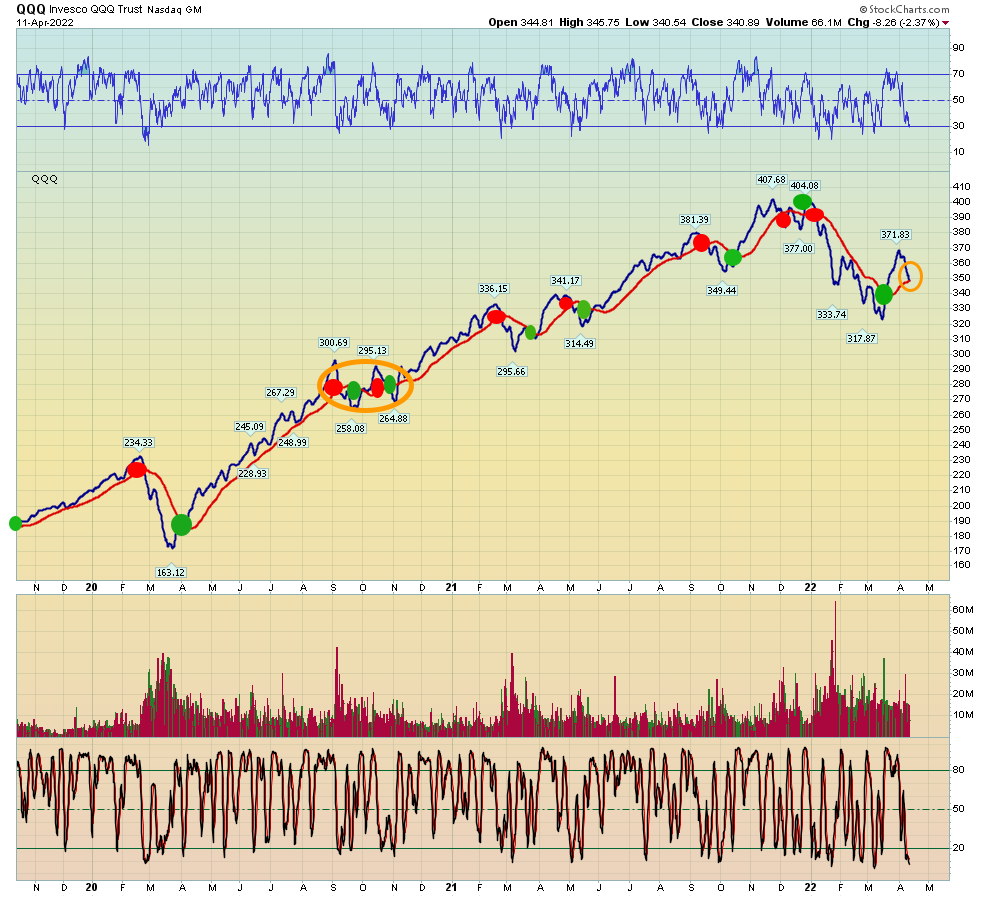
QQQ moving averages chart
A sell signal is almost in play and today a key US inflation report is released.
If it’s concerning, the stock market could begin a new leg down. In the short-term, the stock, commodity, bond, and gold markets are gyrating wildly.
What about crypto?
(Click on image to enlarge)

key bitcoin versus gold chart
Crypto has been hailed as “digital gold” by over-enthusiastic investors who arrived late to the bitcoin party. As somebody who runs a crypto newsletter, sold into the highs and put the proceeds into gold bullion, my take on the matter may carry weight.
If the war cycle brings a civil war to America, crypto could gain some traction against fiat, but not against gold. I’m a huge fan of bitcoin… and a vastly bigger fan of gold. The huge double top pattern on this bitcoin versus gold chart suggests that the price of gold will surpass the price of bitcoin! The bottom line:
Fiat is money. Bitcoin is better money than fiat, and gold is the ultimate money and the ultimate asset. It’s really just that simple.
Silver?
(Click on image to enlarge)
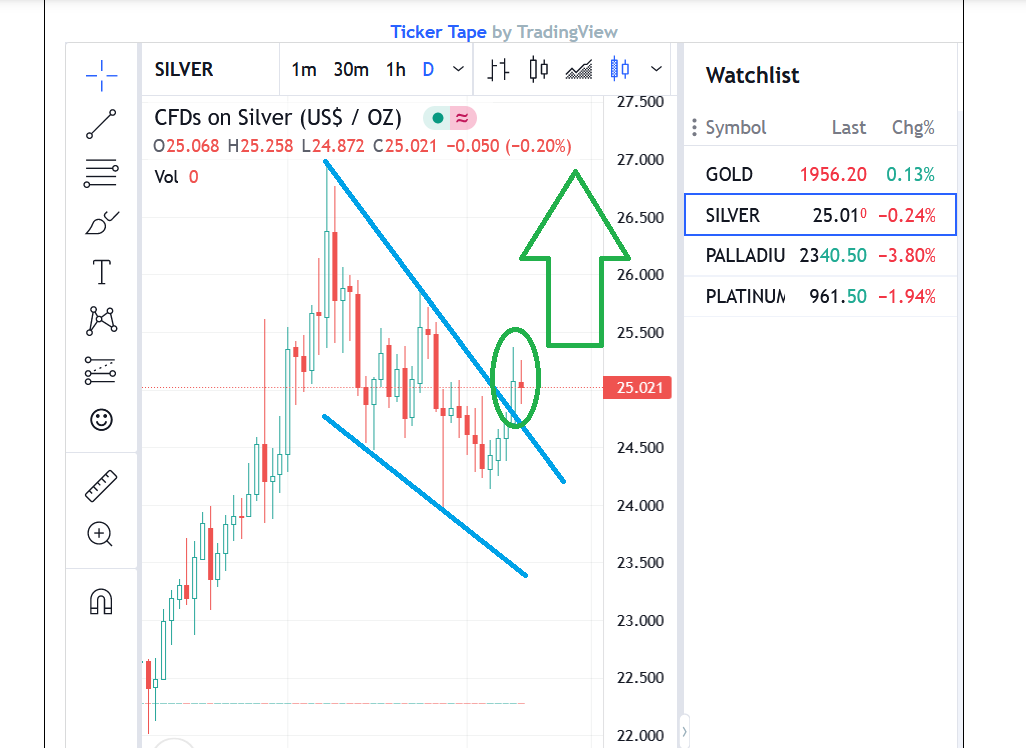
Silver daily chart
There’s a possible bull wedge breakout in play, and it’s doing battle with an H&S top pattern. Today’s inflation report likely determines whether the bulls or bears control the next couple of dollars an ounce for this mighty metal.
Silver could become everything the crypto bugs wanted bitcoin to be (the currency of the people) if food riots and civil war occur in America. With the stock market, bonds, and housing looking shaky at best, the average hungry citizen can’t afford an ounce of $2000 (and $5000 soon?) gold, but an ounce of $25 (or $250?) silver? It could soon be hi ho, hi ho, and up we go!
Special Offer For Website Readers: Please send me an Email to freereports4@gracelandupdates.com and I’ll send you my free “Get Jacked With Gold!” report. I cover key ...
more


