
Why Silver's Bull Market Is Still Young
A few days ago, I published a popular report called “Why Gold’s Bull Market Is Still Young,” where I analyzed gold’s current secular bull market by comparing it to its previous two secular bull markets in the 1970s and the 2000s.
I examined how gold stacks up not only in U.S. dollars but also across a range of other yardsticks, including the U.S. Consumer Price Index, the M2 money supply, the national debt, and the Dow. The purpose was to show that gold’s bull market is still in its early stages, with significant gains still ahead.
Now, as promised, I’ve created a similar report focused on silver, using the same format and methodology. The findings indicate that silver’s bull market is still in its early stages, with significant potential for further gains. So let’s get started.
For the purposes of the exercises in this report, the dates I’m using for the two prior secular silver bull markets are November 1971 to January 1980 for the 1970s bull market, and November 2001 to April 2011 for the 2000s bull market. These timeframes are widely accepted as the official start and end points of those respective bull markets.
As for the current secular silver bull market, while there is some subjectivity and debate around when it began, I’m using September 2022 as the starting point. I believe this is well justified based on where silver bottomed, both in dollar terms and relative to the other four yardsticks used in this report. This can be clearly seen in the charts I’ve included.
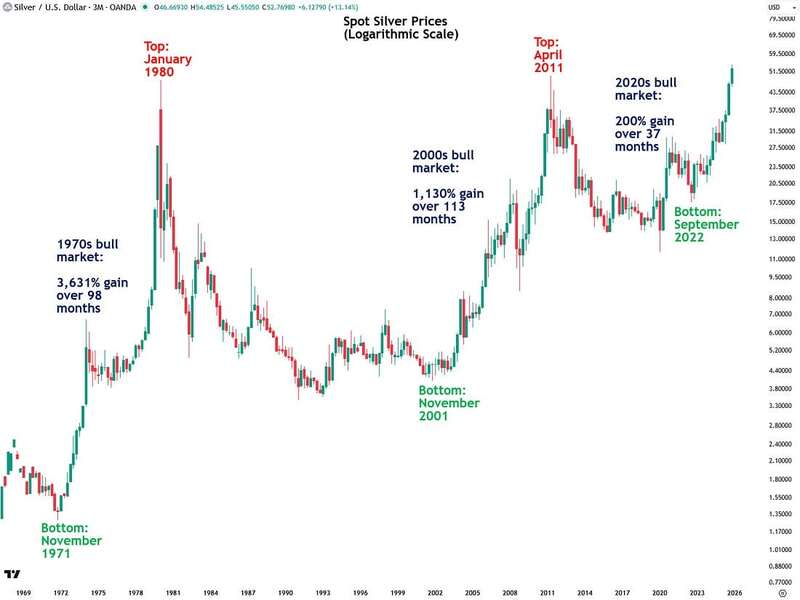
Let’s begin with the most rudimentary reference point: the spot price of silver in U.S. dollars. During the secular bull market of the 1970s, silver rose by 3,631% over 98 months. In the 2000s secular bull market, it gained 1,130% over 113 months.
By comparison, the current secular silver bull market is up only 200% over just 37 months. This is a clear indication that the current bull market is still in its early stages relative to the previous two, and I believe it has much further to run.
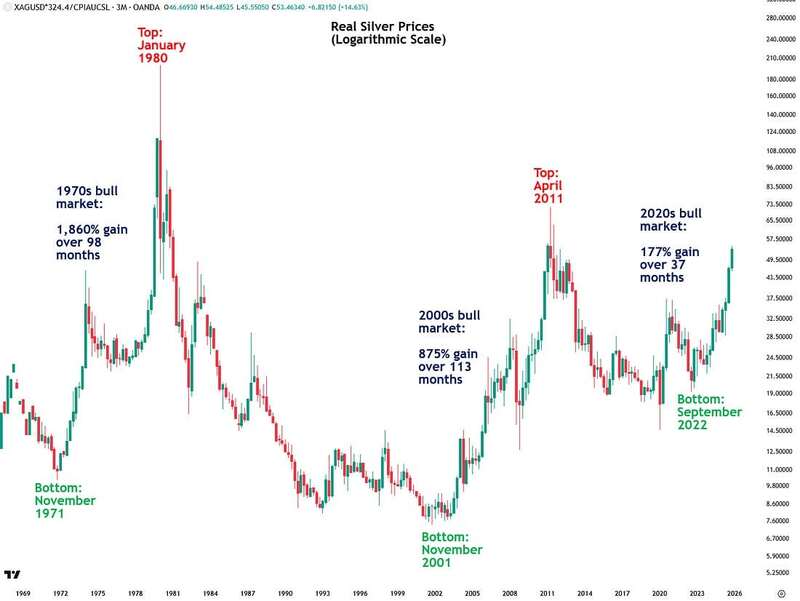
Next, let’s examine the real price of silver, which is silver adjusted for inflation using the U.S. Consumer Price Index (CPI). This is a more meaningful metric than the nominal price shown earlier because the key question is not how much silver has increased in absolute terms, but whether it is keeping up with inflation. After all, precious metals are the best hedges against inflation over the long run.
During the secular bull market of the 1970s, the real price of silver rose by 1,860% over 98 months. In the 2000s secular bull market, it gained 875% over 113 months.
In contrast, the current secular silver bull market is up only 177% over just 37 months. This further supports the view that the current bull market is still in its early stages compared to the previous two, and I believe it is just getting started.
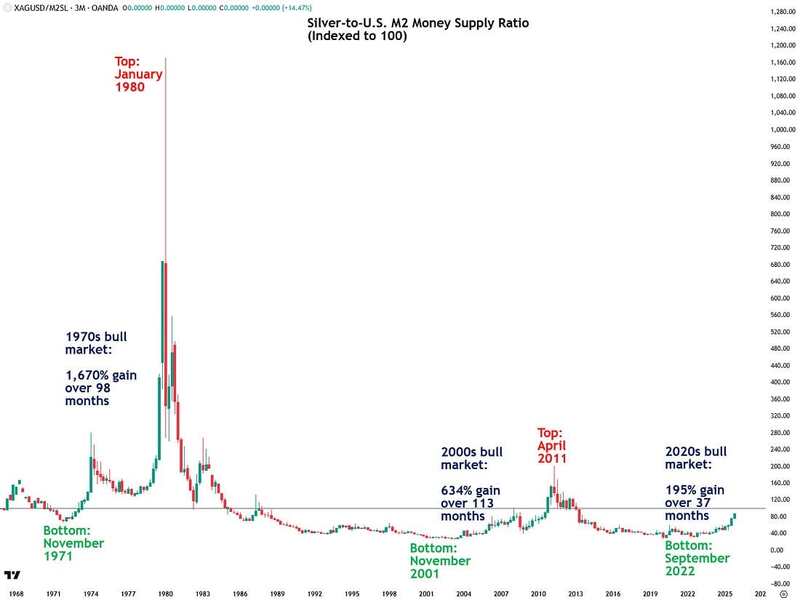
Now we will look at silver in relation to another measure of inflation: the U.S. M2 money supply. The money supply may be an even better indicator of inflation than the CPI, which is known to understate actual inflation.
Moreover, growth in the money supply is the underlying cause of inflation itself. As Milton Friedman, the Nobel Prize–winning economist, famously said, “Inflation is always and everywhere a monetary phenomenon.”
During the secular bull market of the 1970s, silver measured against the M2 money supply rose by 1,670% over 98 months. In the 2000s secular bull market, it gained 634% over 113 months. In comparison, the current secular silver bull market is up only 195% over just 37 months.
This is yet another indication that the current bull market is still quite young, and those claiming it is long in the tooth are clearly out of touch with the objective facts.
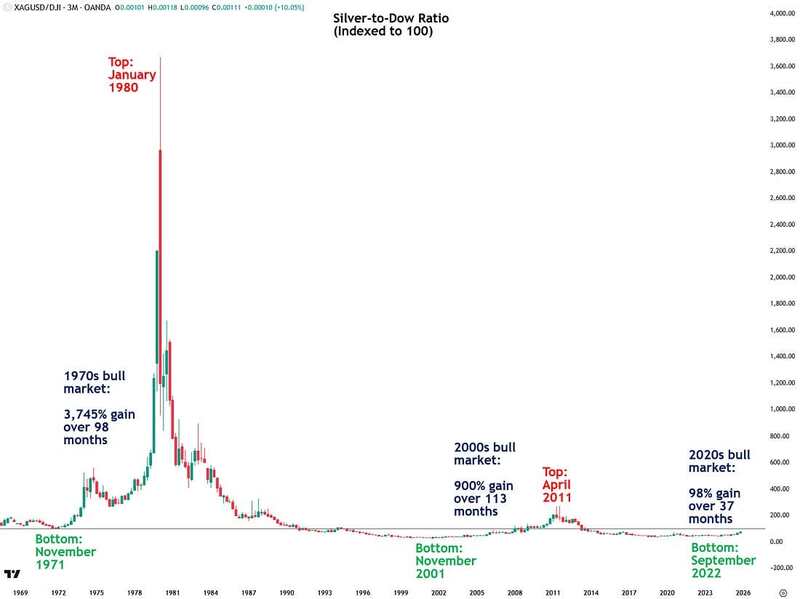
Finally, we measure gold against the Dow Jones Industrial Average, which I find to be a particularly useful yardstick. There is a well-established principle that equities and precious metals move in opposing long-term cycles, where one outperforms the other as large amounts of capital rotate between them.
When major secular bull markets in stocks come to an end, such as in the early 1970s or early 2000s, a significant amount of capital typically flows out of equities and into precious metals, and I believe we are about to see that dynamic play out again, which will send gold and silver current bull market into overdrive.
During the secular bull market of the 1970s, silver measured against the Dow rose by 3,745% over 98 months. In the 2000s secular bull market, it increased by 900% over 113 months. In comparison, the current secular silver bull market is up only 98% over just 37 months, which indicates that, by historical standards, it has barely even begun.
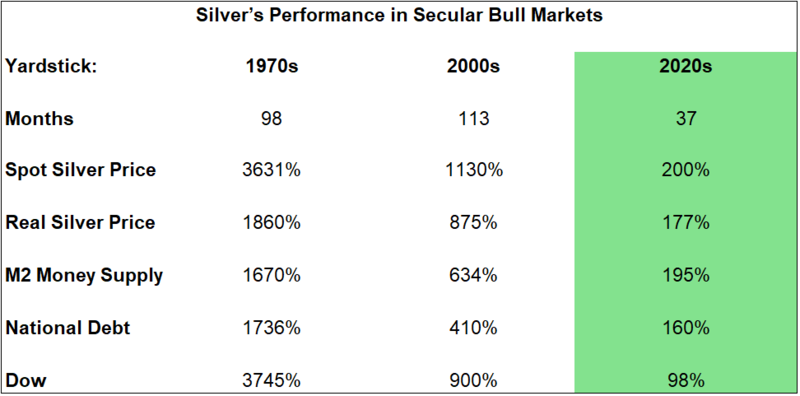
Now that we’ve looked at the various yardsticks in chart form, I’ve compiled all the data on silver’s performance in past and current secular bull markets into this helpful table to show how the current one compares.
As you can see, by every metric, the secular bull market that began in September 2022 still pales in comparison to the previous two. This is a clear indication that it has many more years and gains ahead.
For example, if silver were to match the performance of its 1970s bull market, it would reach a peak of $664 per ounce. If it were to replicate the performance of the 2000s bull market instead, it would peak at $219 per ounce. In both cases, these targets are significantly higher than the current price of $53.40 per ounce.
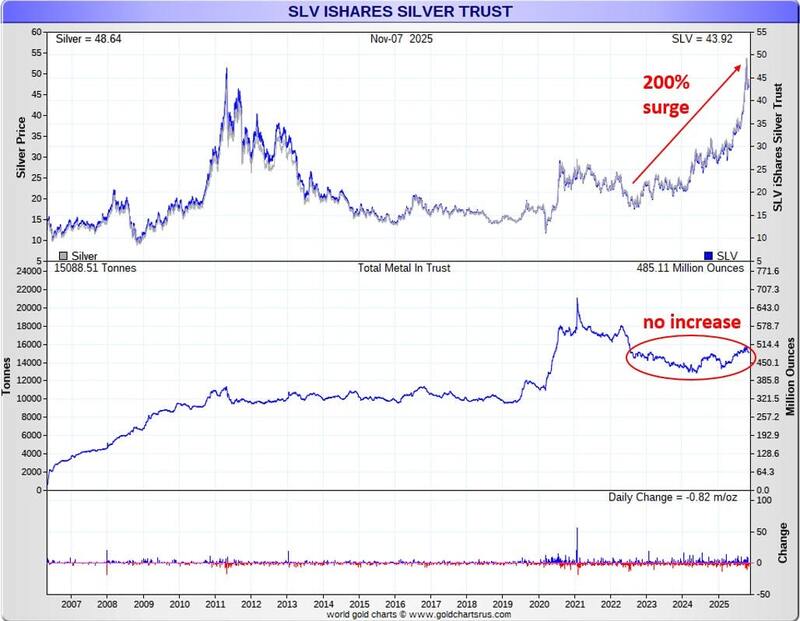
Despite silver’s impressive 200% price gain since September 2022, there is still very little participation from American investors, as evidenced by the largely unchanged silver holdings of the popular SLV ETF.
This indicates that silver’s bull market is far from being frothy or mature and has many more innings to go as American investors eventually pile in and drive it to much higher levels.
Another important factor to consider is that the yardsticks I used to compare the price of silver—the money supply, national debt, and the CPI/inflation—will continue to grow strongly and will even accelerate in the years ahead as we approach the fiscal and monetary endgame not just in the United States but around the world.
That factor alone will continue to push the nominal price of silver higher, even if it does not gain ground relative to those benchmarks, although I expect it will.
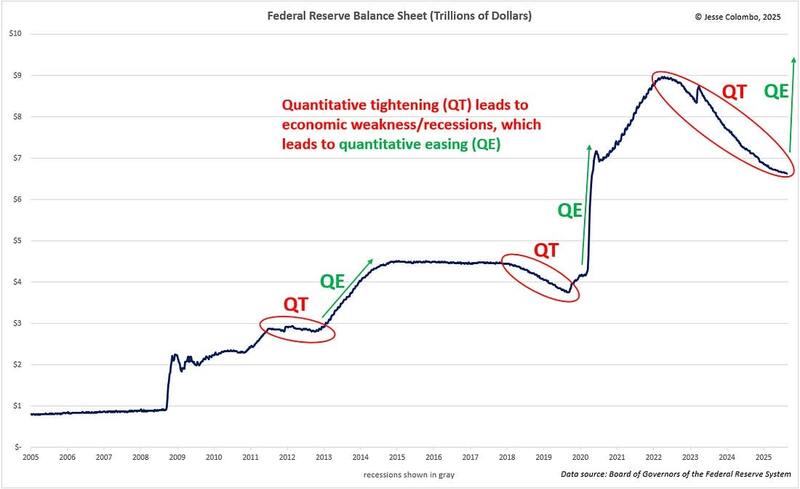
A return to quantitative easing (QE), which is essentially digital money printing, is only a matter of time. No government or central bank can resist using the printing press for very long if they have access to it, and that is the ultimate reason for owning precious metals.
The Fed’s quantitative tightening (QT), or shrinking of its balance sheet, since 2022 has set the stage for the growing financial stress now emerging, which is reminiscent of what occurred in late 2019 and ultimately led to massive QE that was officially attributed to the COVID pandemic.
Notably, at its October meeting, the Fed announced it is ending the drawdown of its still-substantial balance sheet, citing signs that money market liquidity conditions are tightening and bank reserve levels are falling.
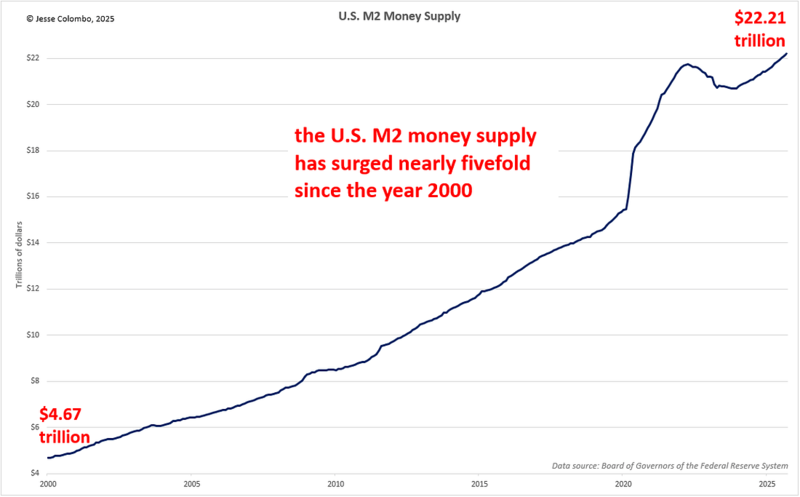
The lack of gold backing of the U.S. dollar and all other major world currencies since 1971 opened the door to rampant money supply expansion, which is the root cause of inflation. The introduction of quantitative easing in 2008 accelerated this trend significantly.
As a result, the U.S. M2 money supply has surged nearly fivefold since the year 2000. This is the underlying cause of the severe cost-of-living crisis we face today, where many hard-working people can no longer afford a middle-class lifestyle.
I expect money supply growth to accelerate even further as we approach the fiscal and monetary endgame, which will be a tremendous boon for gold and silver prices.
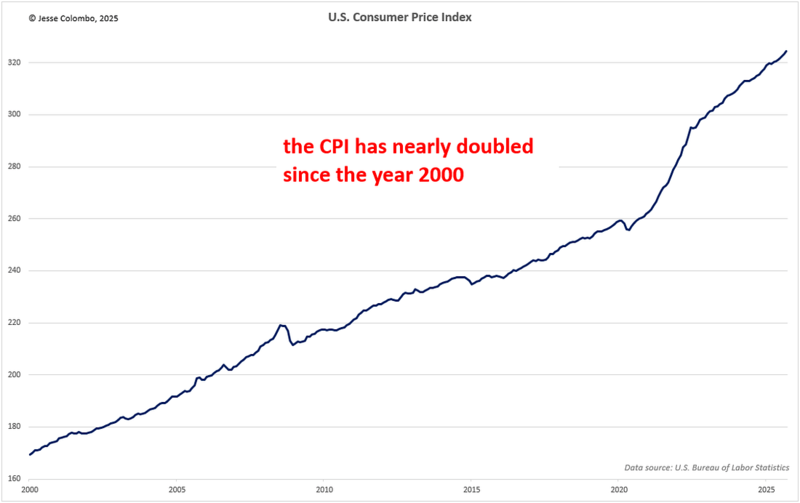
As Milton Friedman, the Nobel Prize–winning economist, famously said, “Inflation is always and everywhere a monetary phenomenon.” It is no surprise, then, to see the most widely referenced measure of inflation, the Consumer Price Index (CPI), surge alongside the money supply.
In fact, the CPI has nearly doubled since the year 2000, placing immense pressure on the middle class and fueling a wave of radical political movements.
An increasing number of politicians are unfairly and incorrectly blaming capitalism for the soaring cost of living, rather than acknowledging the real issue: the abandonment of sound money backed by gold and silver.
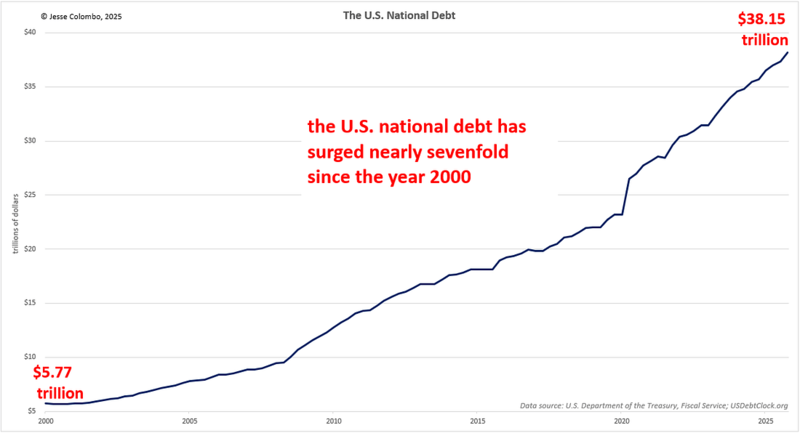
Finally, we turn to the chart of the U.S. national debt, which has ballooned nearly sevenfold since the year 2000, reaching a staggering $38.15 trillion. It is now growing by an astonishing $1 trillion every 100 days.
This trajectory is clearly unsustainable, and we are heading toward a breaking point that will ultimately lead to the collapse of the paper dollar, euro, pound, yen, and all other fiat currencies. And when that happens, precious metals will be the big winner.
Wrapping things up, I hope I have made it clear that silver’s current secular bull market is still in its very early stages, just as I demonstrated with gold in my previous report.
Although the nominal price of silver may appear high and potentially discouraging to some, nominal prices can be misleading. This is why it is important to compare them against other yardsticks to assess whether a precious metal or commodity is truly expensive.
As the findings in this report show, silver remains quite undervalued relative to those measures. This should ease concerns that silver’s price is too high or that its bull market is nearing an end.
More By This Author:
Precious Metals Pullback Is Losing MomentumIs The Precious Metals Pullback Over?
Precious Metals Are Officially Oversold
For the author's full disclosure policy, click here.


