
Why Silver May Hit $50+ In September
An overview of several price projection methods, all of which point to a short-term target of around $50 for silver. In the long run, however, silver is likely to go much higher.
I love it when a plan comes together. And the plan I’m speaking of here is the bull market in silver I’ve been predicting and writing about non-stop since April of 2024. While silver has steadily climbed since then, the road has been rocky as it advanced in a three steps forward, two steps back manner.
But in June, silver finally broke out above the major $32 to $35 price ceiling that had been impeding its progress, and I said at that time that I believed silver had entered a new phase of its bull market that would be much more powerful and resilient.
Sure enough, that is what we are now seeing happen, and I believe it is just getting started. In today’s update, I want to give you credible reason to believe that silver hitting $50 and beyond is actually realistic in September or October.
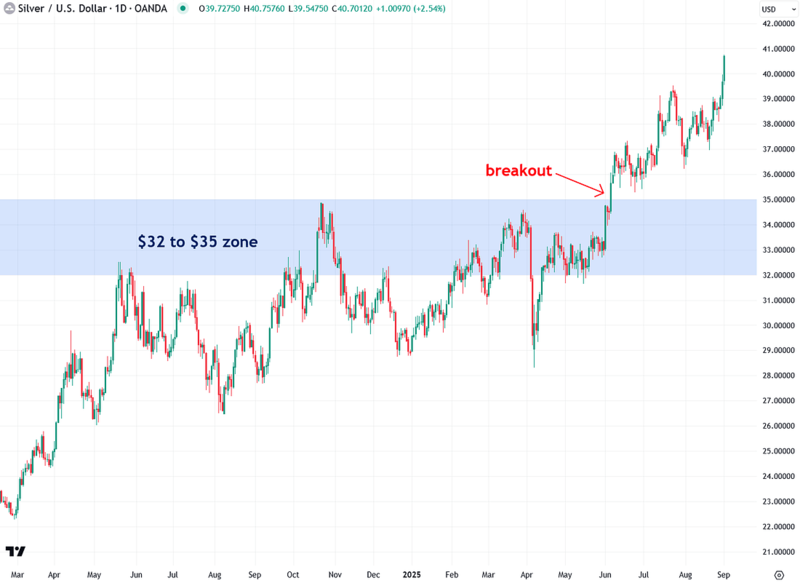
Let’s first take a look at the spot price of silver and how it finally broke above the $32 to $35 resistance zone that acted as a ceiling throughout much of 2024 and early 2025.
When silver broke out in early June, it was a clear sign that a major shift had occurred and that a new bull market was underway. Sure enough, silver is now soaring and has just surpassed the key psychological $40 level for the first time in fourteen years.
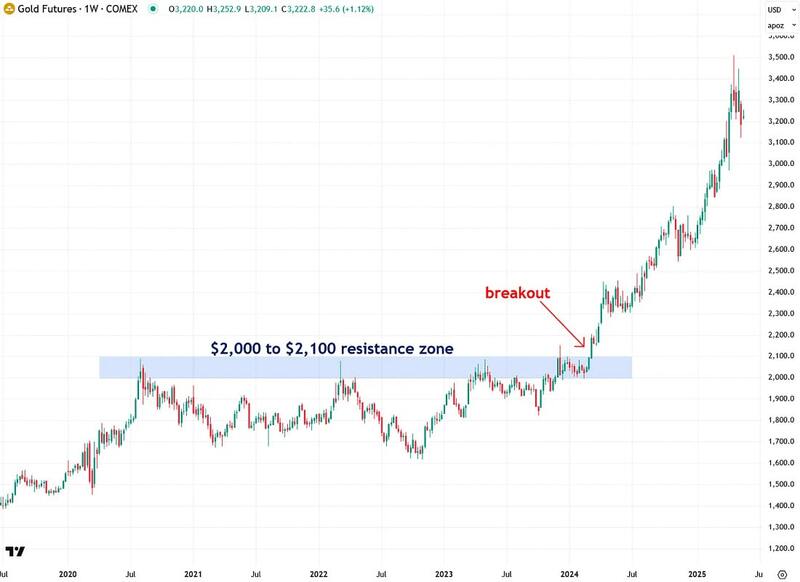
I see strong parallels between silver’s struggles beneath the $32 to $35 resistance zone and gold’s struggles from 2020 to 2024 below its $2,000 to $2,100 resistance zone.
That resistance kept gold suppressed for years until it finally broke out, triggering the powerful bull market it remains in today.
Now that silver has decisively broken out as well, there is a strong chance it will follow a similar path, and it will likely even outperform gold in the near future.
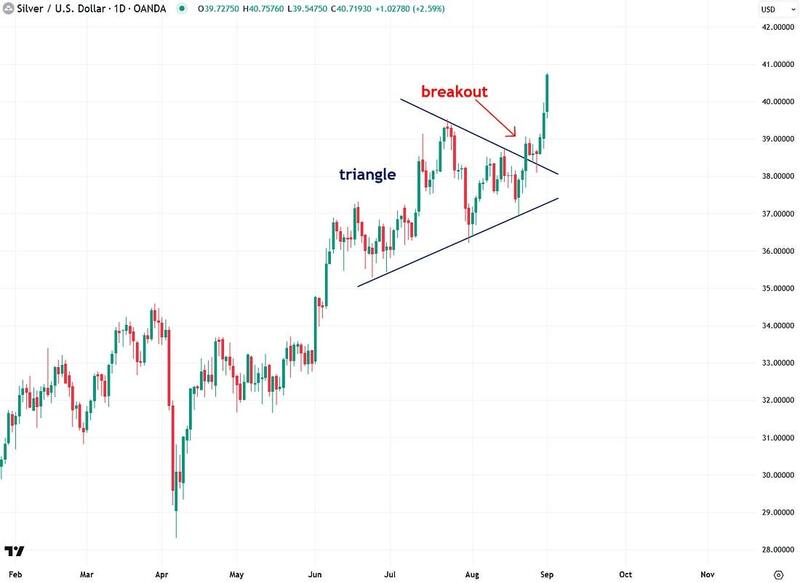
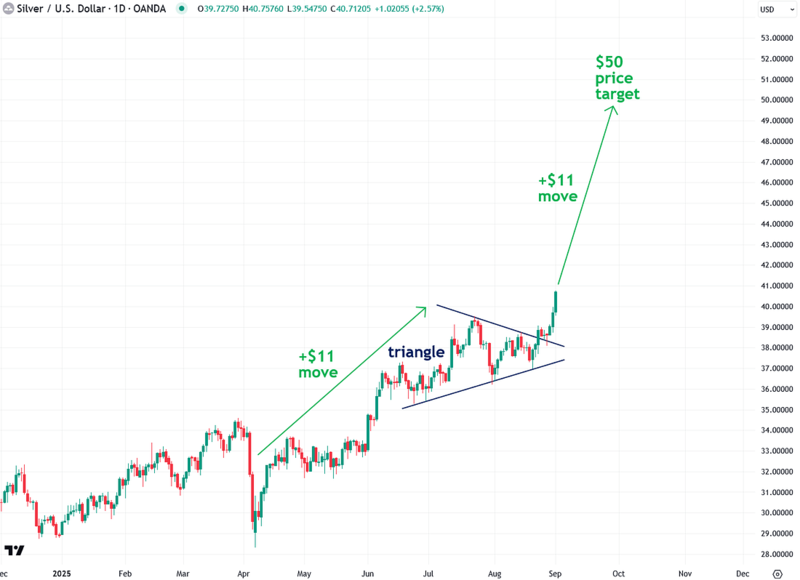
Now that I’ve shown the breakout above silver’s resistance zone, I also want to highlight the triangle pattern that formed over the past few months.
This pattern actually provides a price target for how high silver is likely to climb during the course of this move, which I will discuss shortly.
For now, I want to focus on the triangle itself and the breakout that recently occurred, which has led to a strong rally. Triangle patterns are consolidation patterns that form when a market or asset pauses to catch its breath, and that’s exactly what happened in July and August when silver moved sideways, largely due to Wall Street being in vacation mode.
But now that summer is ending, silver is continuing its bull market just as I’ve been expecting.
Interestingly, now that silver has broken out of its triangle pattern, we can use a principle from technical analysis known as the measured move to project how high it is likely to go. This technique estimates a potential price target based on the size of the prior move and often proves to be remarkably accurate.
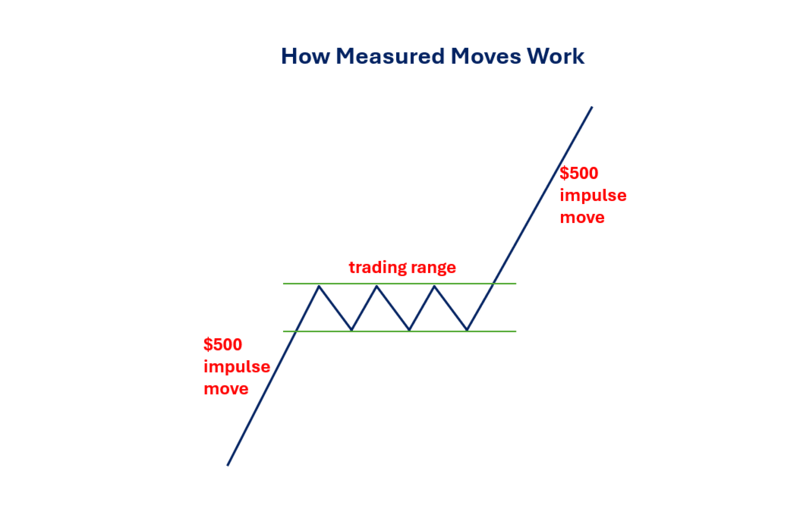
I created the diagram below to illustrate how measured moves work. It begins with an initial impulse move—such as the $500 advance shown in the example.
After that surge, the market or asset pauses to consolidate its gains. This consolidation phase can take various forms, such as a sideways trading range or a triangle pattern.
Once the consolidation is complete, the asset breaks out and resumes its rally, typically rising by an amount equal to the initial move—in this case, another $500. It’s a straightforward concept, but a powerful one.
Now that we’ve established how measured moves work, let’s apply the concept to silver following its breakout from the triangle pattern.
The move leading into the triangle, from April to July, was an $11 per ounce gain. We project that same $11 move upward from the breakout point at $39, which gives us a price target of $50.
Adding further weight to this projection is the fact that $50 is a major psychological level and also marked silver’s historic peaks in both 1980 and 2011.
Of course, this does not mean silver must stop at that level. It simply represents the minimum price target based on the measured move technique.
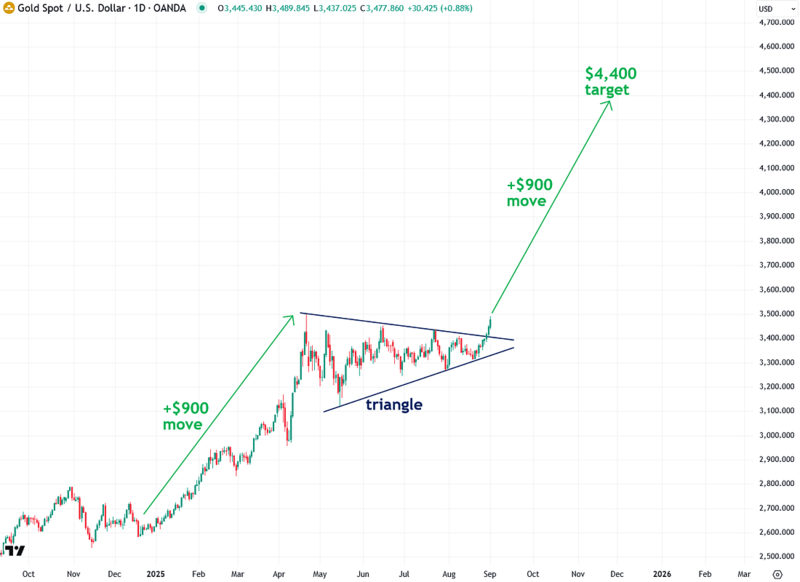
To further confirm the bullish outlook for silver and the related price projections, it’s also worth examining gold, which is now in the process of breaking out of its summer triangle pattern.
Gold plays a major role in influencing silver prices and is one of the key components of the Synthetic Silver Price Index, alongside copper.
We can also apply the measured move technique to gold’s triangle to estimate a potential price target. The move leading into the pattern was approximately $900, and projecting that upward from the current breakout point gives us a target of $4,400.
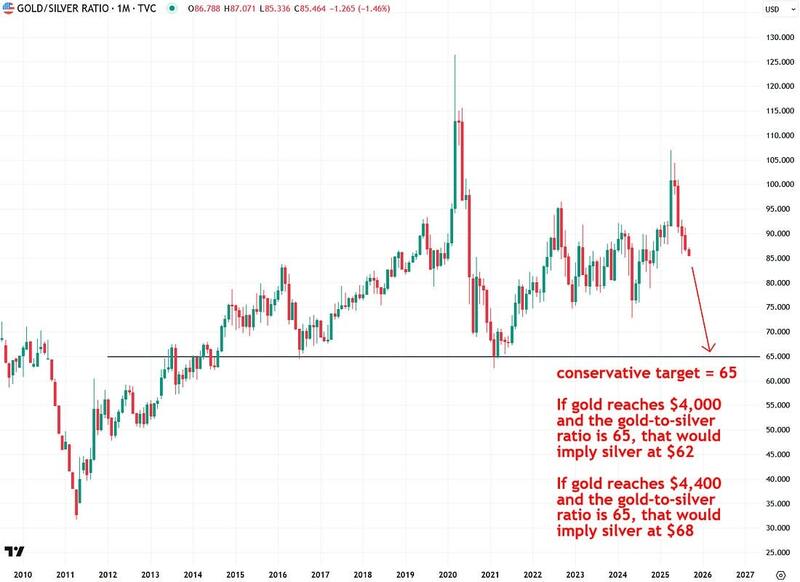
There are several compelling reasons to believe that silver reaching $50 and beyond in the near future is entirely realistic. One of them is the gold-to-silver ratio, which currently stands at 85.46 and shows that silver remains extremely undervalued relative to gold.
For reference, the long-term average dating back to 1915 is around 53.
In the shorter term, during the course of silver’s bull market, my conservative projection is that the ratio will fall to around 65, which also served as a key level in 2016 and 2021.
Doing some quick back-of-the-envelope math, if the gold-to-silver ratio falls to 65 and gold reaches a realistic $4,000, that would imply silver hitting $62, which represents a 52% increase from the current price.
If gold instead reaches the $4,400 price target indicated by the measured move from its triangle pattern, that would imply silver rising to $68, a 67% increase.
Either way, it’s easy to see how significant gains in silver could be achieved from current levels.
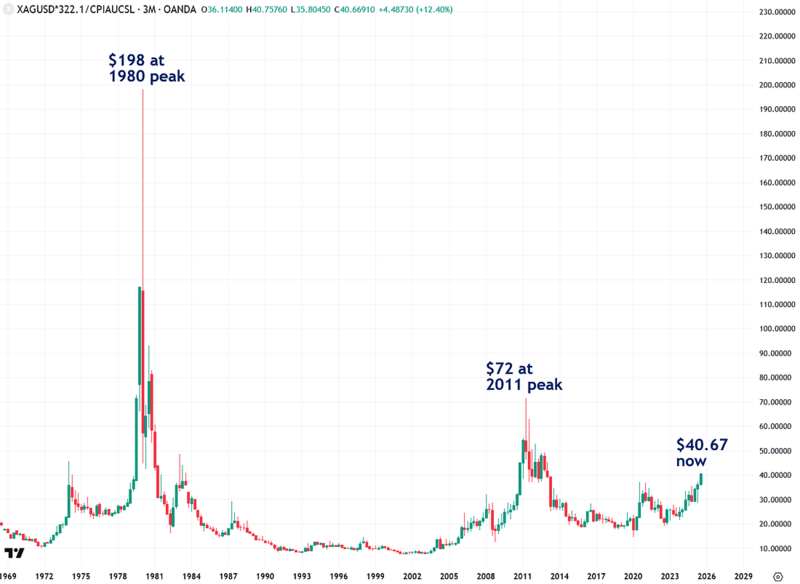
Adjusting silver’s price for inflation makes its historical undervaluation even more apparent, highlighting just how much room it still has to move higher.
During the Hunt brothers-induced spike in 1980, silver reached an inflation-adjusted price of $198. In the 2011 bull market, driven by quantitative easing, it hit $72.
Currently trading at just $40.67, silver has significant room to rise if it’s to catch up with these previous inflation-adjusted peaks.
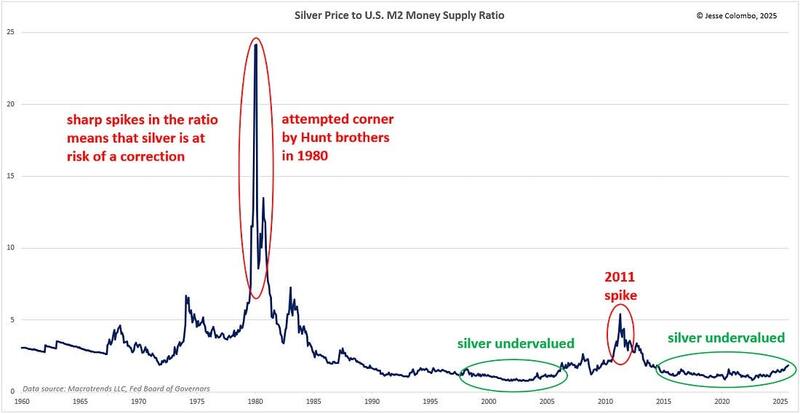
Another way to assess whether silver is undervalued or overvalued is by comparing it to various money supply measures.
The chart below shows the ratio of silver’s price to the U.S. M2 money supply, providing insight into whether silver is keeping pace with, outpacing, or lagging behind money supply growth.
If silver’s price significantly outpaces money supply growth, the likelihood of a strong correction increases. Conversely, if silver lags behind money supply growth, it suggests a potential period of strength ahead.
Since the mid-2010s, silver has slightly lagged behind M2 growth, which, combined with other factors discussed in this piece, position it for a strong rally.
Finally, I want to address what I believe is likely to happen once silver reaches the $50 level. This is a highly significant psychological milestone that also marked the major peaks in both 1980 and 2011. Levels like this often act like magnets, drawing prices toward them.
I believe silver could reach $50 relatively quickly, which is typical when bull markets accelerate. However, once that level is hit, I wouldn’t be surprised to see a temporary, shallow pullback or a period of sideways consolidation as the metal takes a healthy breather following such a strong advance.
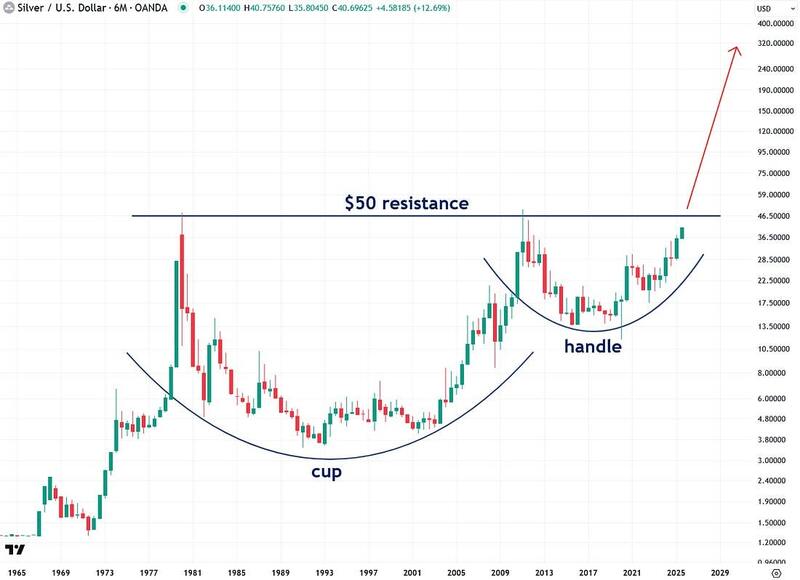
But after that breather, I expect things to get much more exciting, as it would put into play the massive cup-and-handle pattern in silver that stretches all the way back to the 1960s. The resistance level of this pattern is $50, formed by the peaks in 1980 and 2011.
Once silver decisively closes above that level, the pattern points to a move into the several-hundred-dollar-per-ounce range. I fully believe and expect that outcome.
And in case that sounds preposterous, it really isn’t—I see it becoming a reality as the world reaches the end of a massive Keynesian monetary experiment, which I believe will trigger an epic global economic crisis.
Anyway, to summarize, all the stars are currently aligned for silver, which I believe is in the early stages of a powerful bull market that will ultimately go down in the history books.
I presented several methods for estimating how high silver is likely to rise in the short term, and they all point to a target around $50. That is not far-fetched at all, considering silver is currently just under $41.
Of course, I don’t believe the bull market will end at $50—I ultimately see silver going much higher—but I view $50 as a strong short-term target, after which the bull market is likely to accelerate even further.
More By This Author:
A Major Move Is Ahead For Interest RatesPrecious Metals Surge After Dovish Jackson Hole Speech
Gold & Silver Drop As U.S. Rules Out Bullion Tariffs
For the author's full disclosure policy, click here.


