
Why Gold Is Statistically A Profitable And Stable Asset

The long history of the gold market provides us with a sizeable database and, consequently, considerable potential for analysis. In this article, we will focus on the statistics for the gold price since 1968, i.e. over a period of more than 50 years. A study of the statistics on gold shows that it is easy to suppose that it will continue its trend in the very long term.
DISTRIBUTION OF GOLD PRICE VARIATIONS
Just as is the case with all other assets, the price of gold goes up and down. If we map all these variations in a chart, we get a curve of distribution that is more or less perfect, i.e. one that can be described by the laws of statistics. The chart below sets out all of the daily gold variations between 1968 and 2021.
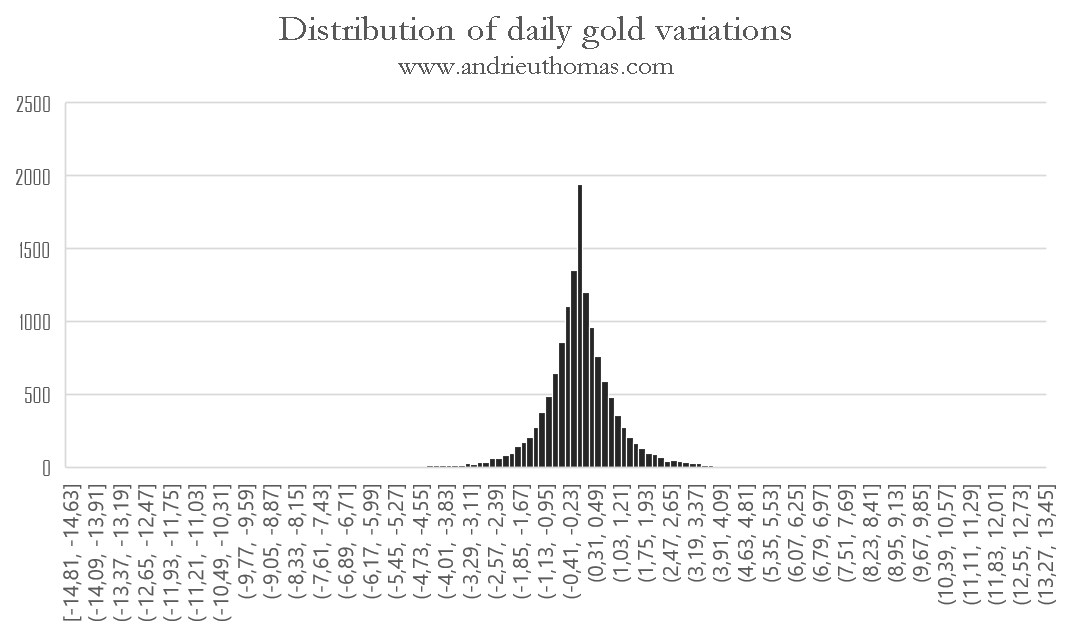
Across almost 14,000 sets of daily data since 1968, the distribution of the variations is, relatively speaking, very orderly. This chart shows us that most of the daily gold variations are in the region of +0.03%. Indeed, the mean value for the daily variations since 1968 is +0.035%. That is equivalent to a theoretical average annual performance of +13.7%, through the cumulative effect of the average daily performances. We can thus expect a gold price somewhere in the region of $1900, on average, in 2021, which does indeed appear to be the case.
Besides showing that gold has been structurally profitable in every era, this chart proves that gold is a very stable asset. The very steep nature of the curve illustrates the fact that gold is not very volatile. More than 2/3 of the daily gold variations fall between -1.19% and +1.26%. For the sake of comparison, more than 2/3 of the variations in the price of Bitcoin fall between -3.88% and +4.5%; or, if one takes the Dow Jones, between -0.45% and +1.75%. Gold is thus 10% more volatile than the Dow Jones, whereas Bitcoin is almost 3.5 times more volatile than gold. Nevertheless, it will be noted that gold is less prone to extreme variations than the Dow Jones.
CONSECUTIVE VARIATIONS OF THE GOLD PRICE
The chart below sets out the variation on day t (x axis) in relation to the variation on the following day, t+1 (y axis). The chart is very homogeneous and bunched together in the center, and this confirms the fact that gold is very stable over time. Statistically, a rise in volatility leads to more extreme daily variations, and thus a departure from the center described in the chart.
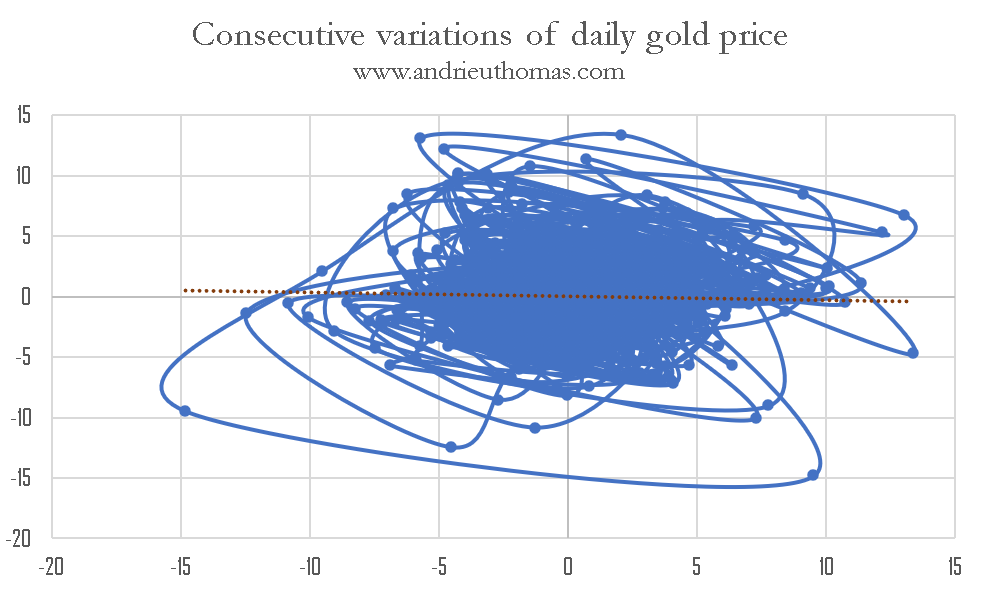
The biggest downward variations occurred in 1980. High instability in the rates, and inflation, naturally led to movements that were more extreme in nature. Gold’s worst daily performance was recorded in January 1980 (-14%), then in March 1980 (-12%). In my book on gold and silver, I highlighted the fact that gold was becoming more volatile, cyclically, on account of the gap between the inflationary cycles and the growth cycles [see article].
DAILY GAPS BETWEEN THE GOLD PRICE
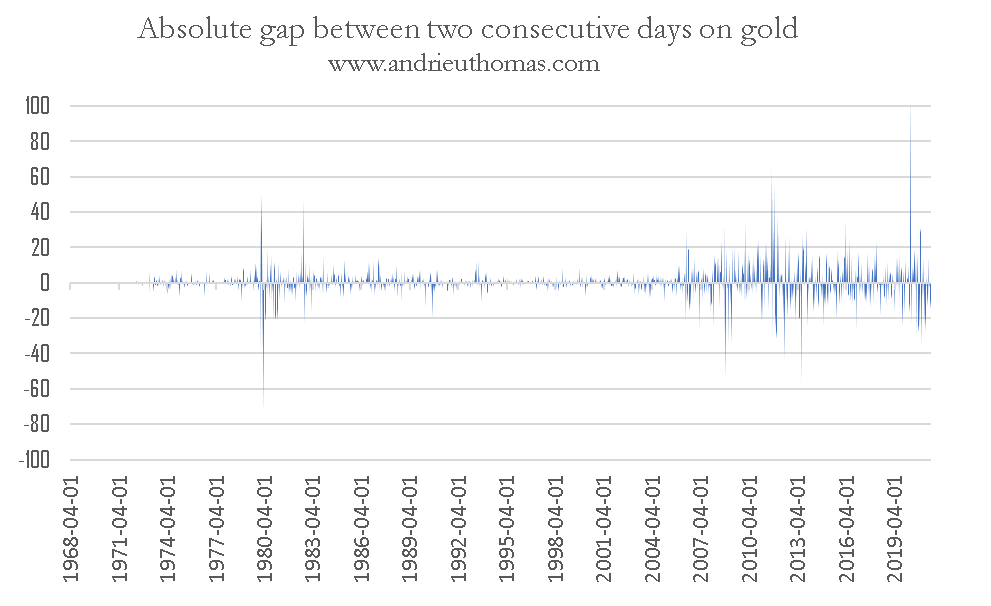
By contrast with most assets, gold retains a certain stability in the variations observed. The chart above shows the absolute gap in the price of gold (in dollars), between two consecutive days. The period of instability between 1979 and 1981 can clearly be seen. Thereafter, the absolute gold variations remained very calm up until the start of the 2000s. Gold, like the other assets, reacts in cycles of variations.
If we map the variations in the daily gold price gaps, we obtain a law of distribution that is even more precise than the previous one. That is to say that the daily gold price gaps follow particularly regular laws.
INDICATOR OF VARIATIONS
One method of determining when is a good time to buy or sell is to add together the preceding variations. The further back into the past the total goes, the more the indicator can be said to be in a channel, and the more it provides signals to buy or sell in the long term.
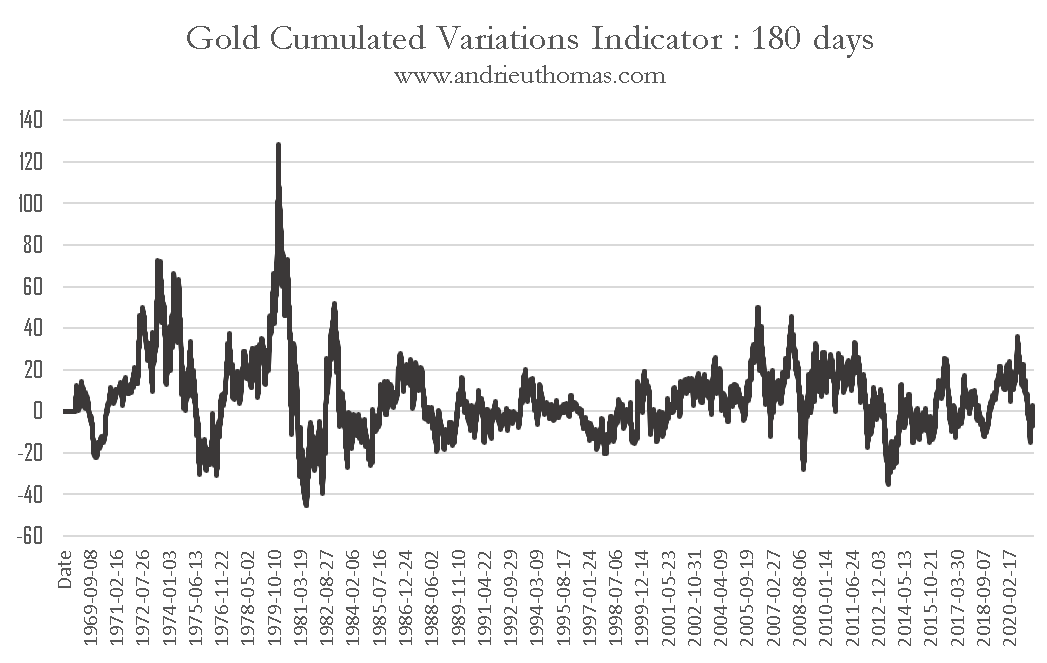
The chart illustrates the cumulated daily variations over the last 180 days. It confirms our analysis, according to which, gold should remain strong in the long term. Indeed, the cumulated variations show that gold is benefiting from its habitual statistical potential. Although the usual corrective phases could manifest themselves, the fact that the statistical indicator is on key supports greatly limits the risks of a major correction to the gold price in the long term (toward $1500, let’s say, for example). The indicator has also incorporated the turnaround from August 2020, as well as the previous ones.
It can definitively be said that gold is an eternally stable asset. It has one of the lowest levels of volatility one can find anywhere in the markets. What’s more, variations of an extreme nature are very rare. Furthermore, by contrast with most other assets, the absolute gold variations demonstrate stability and a high degree of regularity. Finally, the study of the statistical strength of return at 180 days indicates that gold is not overpriced. The recent correction to gold since the summer of 2020 has cut off gold’s strongly bullish trend. Nevertheless, it is enabling gold to enter into its statistical norm, i.e. to continue its over-performance on the currencies in the very long term.
Disclosure: GoldBroker.com, all rights reserved.


