When This Happens, New Secular Gold Bull Begins
Real Interest rates are the key driver for precious metals. Specifically, declining real interest rates and negative real interest rates drive precious metals higher.
However, there is a second driver that speaks to the secular trend and over the years I have learned this is as important as the trend in real interest rates.
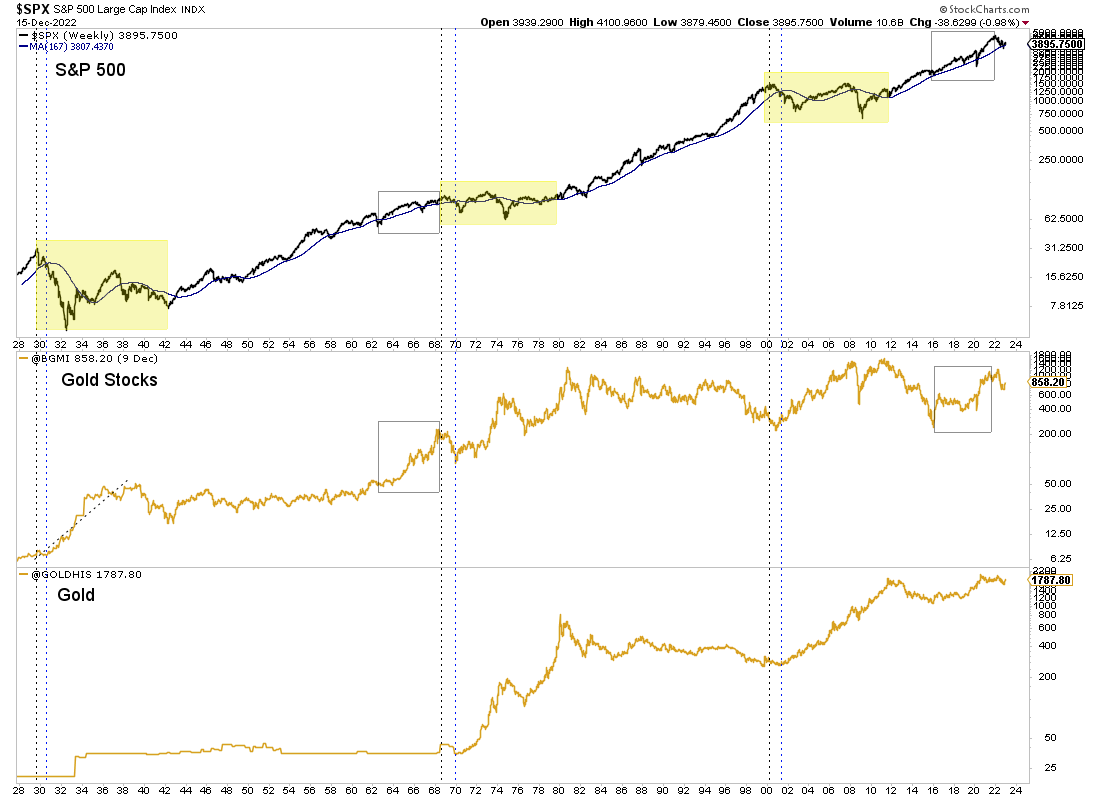
The best moves in precious metals (excluding the 1960s) all occurred during secular bear markets in US equities. Those secular bears occurred from 1929 to 1942, 1968 to 1982, and 2000 to 2009/2011.
As an aside, gold stocks performed very well in the 1960s but by that time the US equity bull market had slowed down considerably.
The cyclical bull market in Gold from August 2018 to August 2020 did not evolve into a secular bull market because the US stock market remained in its secular bull market.
The chart below provides a historical context between the S&P 500, gold miners (Barron’s Gold Mining Index), and Gold.
The vertical lines show the start of the secular bear market and when the S&P 500 declined below its 40-month moving average. The Gold bottoms in 1970 and 2001 coincided with the S&P 500 losing its 40-month moving average.
(Click on image to enlarge)

In my opinion, Gold and gold stocks have already bottomed. Note that the gold stocks bottomed in late 2000, months before the S&P 500 lost its 40-month moving average.
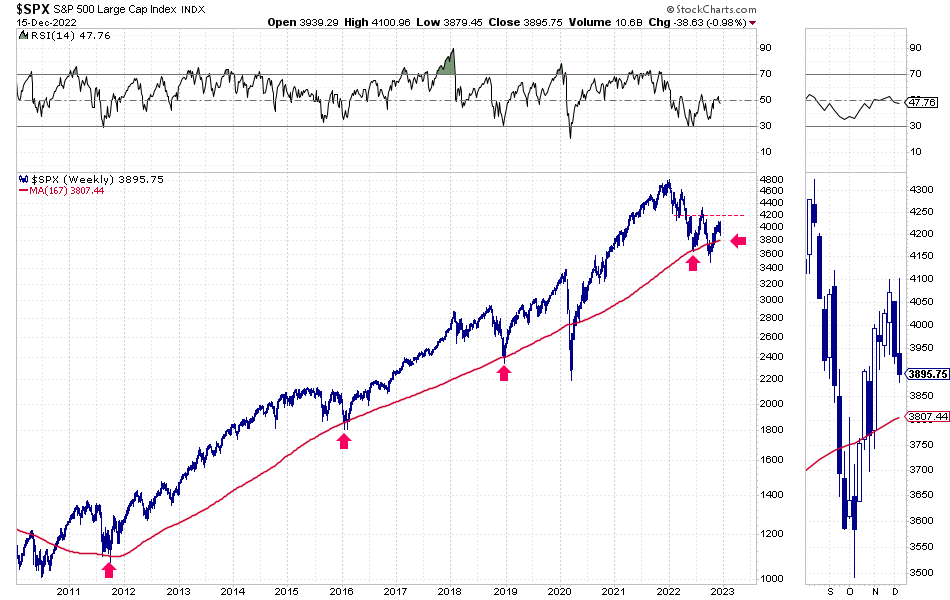
In any case, if the S&P 500 were to lose its 40-month moving average (around 3,800) and lose the recent low of 3,500, it would all but confirm the stock market is in a new secular bear market.
(Click on image to enlarge)

Needless to say, that would be an incredibly bullish development for precious metals. Perhaps the most bullish development of the last two decades. Only Gold breaking past a 12-year base and $2,100/oz would exceed that.
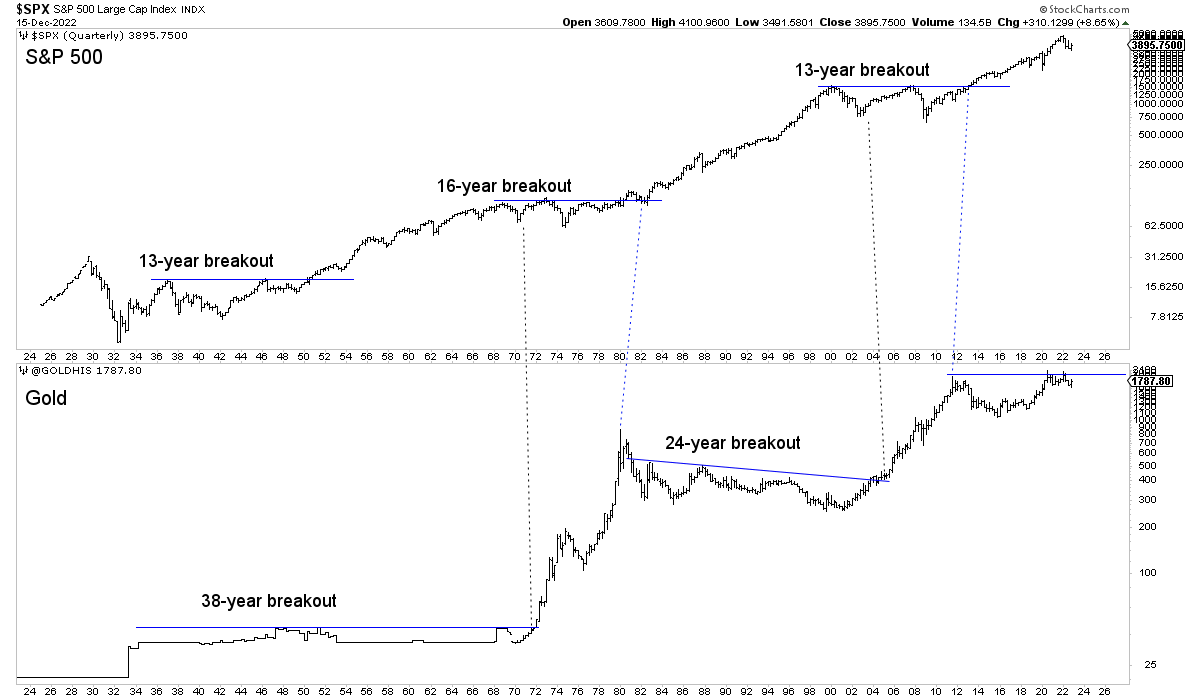
In the chart below we find that multi-decade breakouts in Gold and the S&P 500 usually follow a major secular peak in the counterpart.
(Click on image to enlarge)

The big breakouts in the S&P 500 (2013, 1982, 1951) followed major peaks in hard assets. The major breakouts in Gold (1971, 2005) occurred after the secular peaks in stocks of 1968 and 2000.
In short, the S&P 500 resuming its downtrend and falling to lower lows is an extremely important catalyst for precious metals and may only be a few months away.
As noted in our last missive, because precious metals have rallied with the stock market, they will likely sell off as the stock market rolls over toward key support levels.
However, that is exactly the time we want to be buyers.
Pay attention because we could see some incredible values emerge over the weeks ahead.
More By This Author:
Stock Market Crash Risk In 2023
Gold & Silver, Miners Weekly Outlook Dec 12-17
Gold Vs. S&P 500 Update
Disclaimer: TheDailyGold.com and TheDailyGold Premium are not investment advice. The website, email newsletter and premium ...
more


