

Inflation is on the minds of consumers and traders every day, and oil prices are at the epicenter. This week’s Consumer Price Index (CPI) and Producer Price Index (PPI) reflect the historic inflationary pressures being felt, and the further inflationary pressures in the pipeline. With oil futures recently testing $130.50 on March 7 and retracing to $93.53 on March 15, where will oil go from here? The answer to that question may help you trade oil and oil stocks, but it may be a key indicator whether headline inflation is ready to head lower.
Let’s take a closer look at the term structure of oil futures, the technicals, and what yesterday’s option trading activity tells us.
Term Structure of Oil Futures
Crude oil futures exploded higher at the outset of the war in Ukraine. However, the bullish die for oil was cast early in 2021. During my daily chat session on TheoTrade, I frequently review oil futures and provide an outlook for prices. In fact, I wrote a blog post in November 2021 explaining why oil prices were likely to rise significantly. This outlook was driven by recognizing how the oil futures market was structured. The structure tells you whether there is an implied shortage or a potential oversupply.
What do I mean by term structure? This is referencing whether prices for oil futures contracts are rising or falling as you increase the time to expiration. Simply put, if prices are rising, it’s called contango. If prices are falling, it’s called backwardation. To help explain term structure, let’s look at inventories and how the oil futures market structure has changed since the beginning of 2021.
Because of the physical delivery of the oil futures contract, the forward or future price of oil is not reflecting future oil price expectations. It’s reflecting the net cost of carry. A backwardation market for oil reflects expectations for an oil shortage as there exists a positive net cost of carry for oil. The cost of carry reflects the costs of storage and financing of oil, but also the return from leasing the oil out. The positive cost of carry is reflected by the lower oil prices in the future contract expirations.
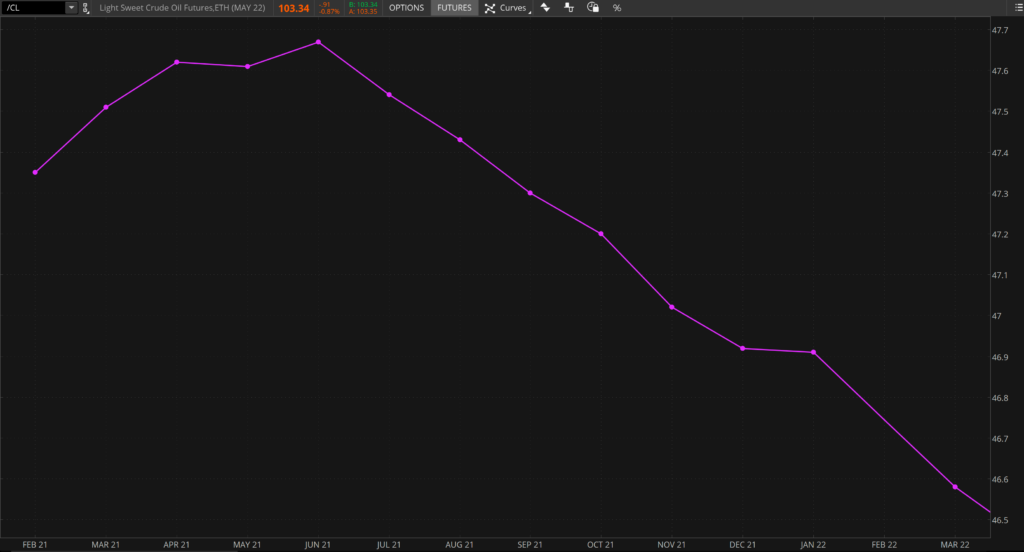
Oil Inventory data
Since the term structure generally reflects oil inventories, here is a graph of oil inventories relative to its 5-year supply range. At the outset of 2021, oil inventories were at the top end of the 5-year supply range. At this point we had just worked off the oil glut resulting from global COVID policies. By the end of 2021, inventory levels had moved below the 5-year inventory range. Low supplies coupled with lower production levels placed oil in a very bullish position.

Oil Futures Progression
The higher inventory levels and uncertainty over future oil production led to a normal contango market at the outset of 2021. Here is a chart of the term structure of oil futures on January 4, 2021. Notice the rising term structure in the shorter months and then it began to fall after June 2021. This is a normal contango market for oil.
(Click on image to enlarge)
By February of 2021, oil inventories quickly fell into the 5-year range with supplies failing to keep up. This is when the oil market flipped from contango to backwardation. Here is a chart of the oil term structure on March 8, 2021. Notice how prices are falling as the contracts move out in time. At this point, the market was pricing in a potential shortage and a positive cost of carry.
(Click on image to enlarge)

With oil inventories holding well below the 5-year range, any supply disruption can cause big moves in oil as we saw in early March. The chart below shows the current term structure of oil (Red) and the term structure on March 7, 2022 (Yellow). Notice how steep the backwardation was in March as prices were surging. While the curve has flattened, we’re still in backwardation with low inventory levels and oil production still constrained.
(Click on image to enlarge)

As you consider the surprise oil inventory build reported on Wednesday, it makes you wonder what the next step for oil will be. Considering the term structure and supply data, it certainly appears that the risks are still to the upside. However, monitoring the weekly inventory data and if the term structure progresses to a contango market will be a bearish key for oil and oil stocks.
Oil Option Activity
While there was a surprise inventory build of over 9 million barrels on Wednesday, the price of oil rose, and oil stocks performed well. Also, below most trader’s radar was a series of unusual option activity trades. Unusual option activity generally refers to significant opening volume on short-dated, out-of-the-money (OTM) options. The size, short expiration, and OTM positioning provides a direction, near-term price target, and timeframe for a potential move. Yesterday’s activity was particularly bullish.
This activity saw several rolling trades and some outright long call trades on several oil stocks. During my chat session yesterday, which we run during market hours, I walked through a UOA search where we analyzed the trades that were happening in the energy sector. Here is a sample of that activity:
Diamondback Energy Inc (NASDAQ: FANG)
- 9,300 15 JUL 22 $160 calls mostly bought in 2 prints against open interest of 166
Devon Energy Corp (NYSE: DVN)
- 3,800 20 MAY 22 65/75 long call vertical mostly bought
Marathon Oil Corporation (NYSE: MRO)
- 26,000 15 JUL 22 $27 calls mostly bought against open interest of 2,066
While this is just a partial listing, it does give an idea of the breadth and types of trades taken. Utilizing OTM options and particularly long call verticals is a great way to speculate to the upside without the significant risk of a correction. The rising implied volatility for the call options on stocks like DVN make the verticals relatively cheap.
Yesterday’s activity was particularly useful at affirming the bullish outlook on a day where inventories rose, but it was also a day of profit-taking as profitable positions were rolled to higher strike prices.
Oil Technicals
The oil futures price broke its upward trend as it closed below its trendline on April 6. This development put oil prices in more of a neutral pattern since that time. However, it was able to hold on to it’s $95 support that it has established since mid-February. This week’s rally only confirmed that level as being significant for traders. The recent bounce finds the price looking to test previous highs near $116 and even $130 in the coming weeks to months.
(Click on image to enlarge)

Conclusion
The ability of oil to hold its $95 support was a big key and the options market for energy stocks appeared to accept that as well. The undersupplied nature of the oil markets, the backwardation term structure and price support point to the upside risks in oil and inflation. While oil may remain rangebound, as we saw in March, the upside risks can be substantial and the option implied volatility favors trading that potential through long call verticals.


Comments
Log in or sign up to join the conversation.