What FOMC Minutes, CPI & NFP Numbers Mean For The Markets?
The market seemed to be gaining steam a couple of weeks ago, as the Fed was showing signs of hope for Non-Farm-Payroll data to show glimpses of tightening. But as the soul-crushing NFP numbers have hit the public, the markets had awoken to a gloomy morning yet again.
More in Fed Minutes
On Wednesday, the Fed released the minutes of the FOMC meeting held on September 20–21, 2022. The minutes from the meeting will be published in the Board’s Annual Report.
At this meeting, the Fed admitted that their rate hike would slow down economic activity in the near future. According to the minutes, they generally believe that the US economy will grow more slowly than usual in the next few years and that the labor market will become less tight.
This was the wrong assumption when it came to the labor market – it remained tight and caused a retreat after the NFP numbers were released.
The September minutes from the central bank’s meeting reflected a hawkish tone, with the word “restrictive” appearing 13 times, as opposed to 0 times in the July minutes. Inflation was mentioned 89 times in the most recent meeting’s account, vs. seven times in the previous meeting’s minutes.
(Click on image to enlarge)
The initial headlines reading “HOTTER THAN EXPECTED” caused a 3% market drop as investors anticipated hellish conditions.
However, a massive rally mid-day caught short sellers by surprise and caused them to cover their positions.
Deconstructing CPI Numbers
Before diving into the inflation numbers, let’s take a look at what Analyst Dr. Patel of the “FinTwit” community is saying about the market, after all a bit of humor is what the economy needs should it fall on its backbone in the coming months/years.
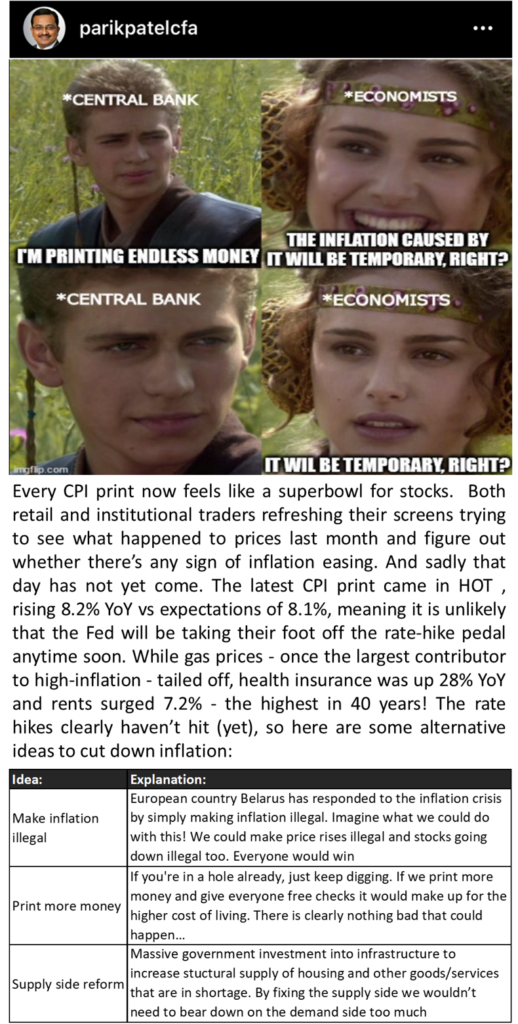
So what does the latest CPI Report communicates exactly?
Energy, Housing, Food, Cars
Cribs, new vehicles, as well as medical indexes, were the ones seeing the highest change in price increase, while gasoline and used car prices subsided.
Housing Market
When it comes to the print and 1/3rd of the overall CPI index, shelter costs make up the largest component of services. Shelter costs rose 0.7% MoM, representing a 6.6% increase on a YoY basis.
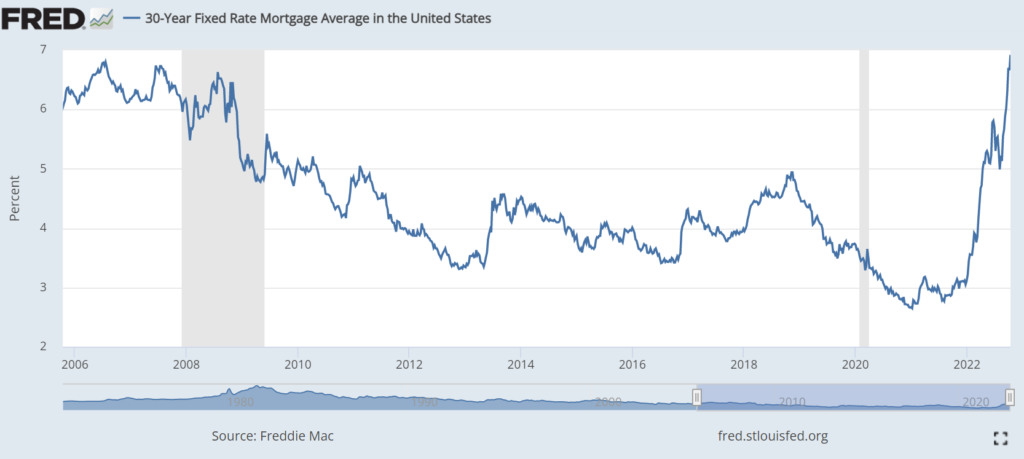
However, to me, this still seems low and there is still much to go when it comes to house prices. Mortgage rates have more than doubled since the beginning of the year, as the average contract on a 30-year fixed-rate mortgage ballooned to 6.81%, the highest level since 2006.
Energy Market
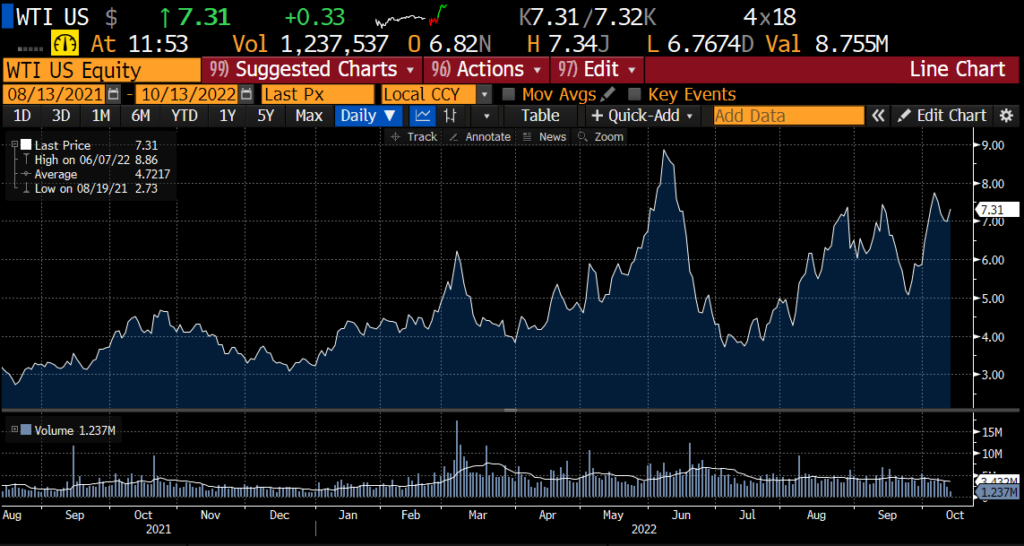
MoM, energy saw a 2.1% decline but is up 19.8% YoY. The most notable decline was gasoline, down 4.9% MoM. This makes sense when you look at the WTI chart.
This being said, the price stability or further decline is far from set in stone given the further politicisation of the issue (including the war in Ukraine situation).
Cars
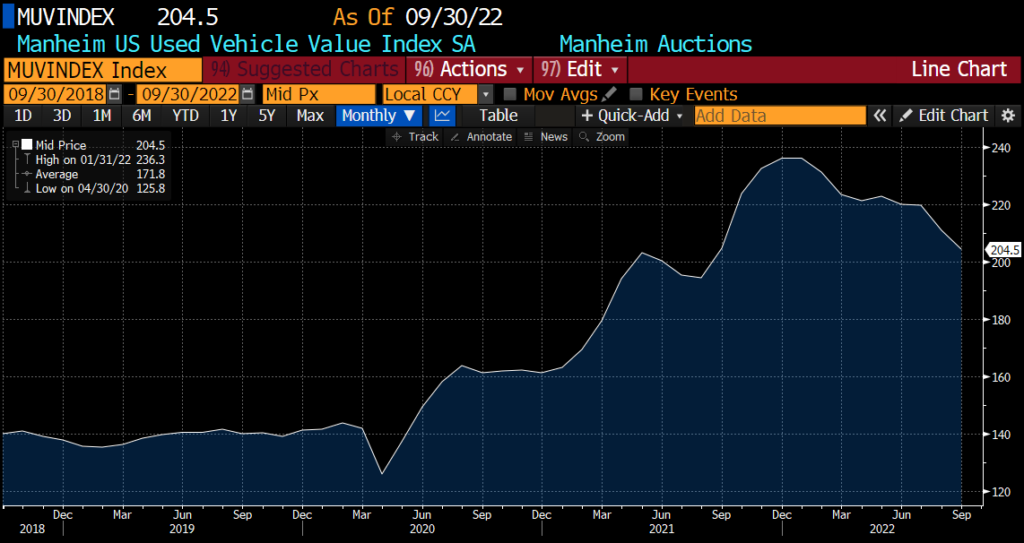
Interesting tidbit about autos; used cars went down 1.1% last month while new cars increased by 0.7%. It seems that commodity prices and supply chain issues are pushing new vehicle costs up, while at the same time, people’s purchasing power is being squeezed, resulting in fewer used car sales.
The Manheim used vehicle index is the best way to gauge the temperature of the market, and this downtick lines up with that.
Food
Groceries and prices continued to rise in September, contributing to the worse-than-expected print. Food costs rose 0.8% MoM and 11.2% YoY.
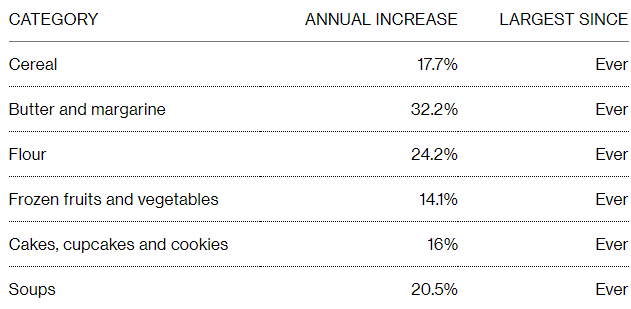
Grocery prices were up 13% YoY, making eating at home expensive for every item on the grocery list, from flour and cookies to turkey and canned fruits and vegetables.
It’s not clear what changes should be set in motion for the situation to change, it sure does not look like we are getting prices back to 2021 levels any time soon (very likely, never).
Next FOM Meeting Forecast
You don’t have to be a fortune teller to understand that the minimum Fed is going to hike, will be 75bps (futures went from 84% on Wednesday to 98% now).
A big read here is just how strong and sticky the core is. Once the components behind the core go up, they take a very long time to “work it out” of the system. It seems that Powell’s Jackson Hole speech was quite prescient when it comes to “higher for longer” which means a prolonged period of contractionary fiscal policy.
The Fed can only step off the brakes if inflation cools and the labor market weakens, neither of which happened.
The decade of low volatility and slow, steady growth is over. We’re going to see many more market dislocations from now on. For the moment, it looks like the market is “bending but not breaking.” Something has to break eventually, though. So are we to see the “bottoming” any time soon?
The market seems to be still trying to figure out how deep and long this bear market will be.
In order to get a bottom drawn in, we need to see the end of the hiking cycle. The inflation and labor market picture are still so important, and unfortunately for the economy, too nebulous.
The main point to take away from this is that the market never bottoms during a rate hiking cycle.
Once the data shows prospects (lower NFP and CPU digits), we will still need to see how Fed is going to interpret the prospects. That’s when the volatility can hit us the hardest, pairs related to USD can rally in unison with the major US and Global indices.
For now, though, the bottom does not seem to be on the horizon. Too many things have been in too much fog for too many years.
More By This Author:
Weekly Waves: EUR/USD, Bitcoin And GasIs Bitcoin About To Break(out)?
The Economy Looks Bad – IMF Says
Disclaimer: CFDs are complex instruments and come with a high risk of losing money rapidly due to leverage. On average around 80% of retail investor accounts loose money when trading with high ...
more


