
Weekly Waves: EUR/USD, XAU/USD And Bitcoin
Our weekly Elliott Wave analysis reviews the EUR/USD 4 hour chart, the XAU/USD weekly chart, and the Bitcoin weekly chart.
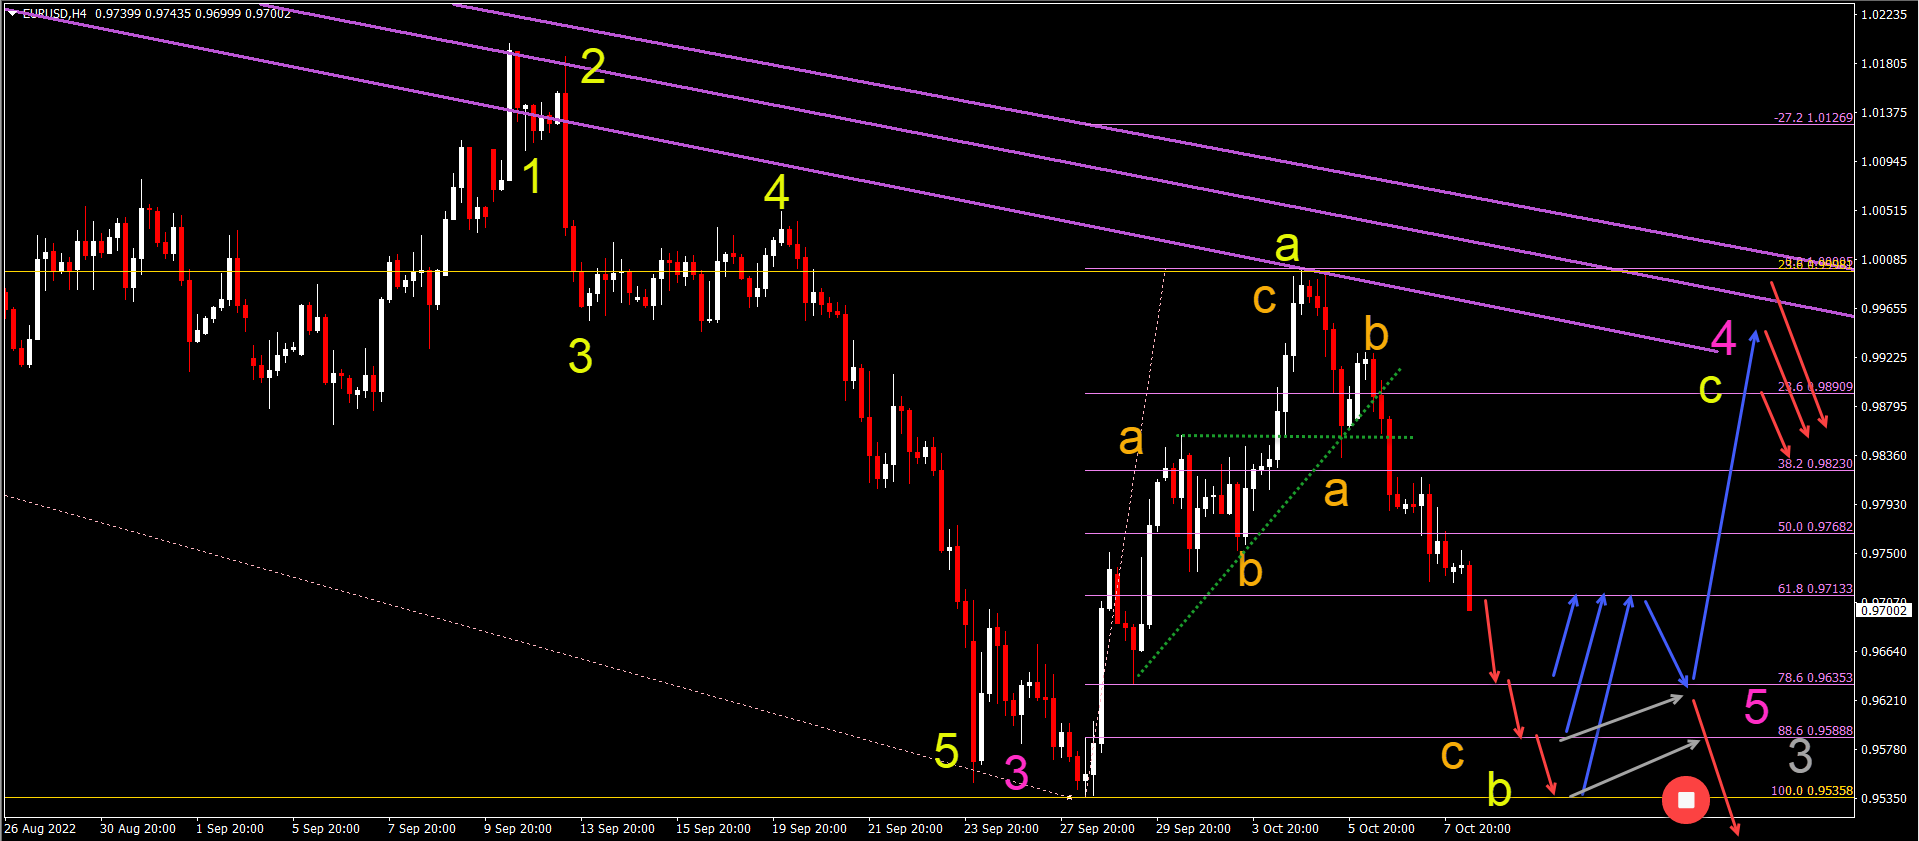
EUR/USD Bearish Decline in ABC Pattern
The EUR/USD break below the support zone (dotted green), which indicated a larger bearish move rather than a bullish correction:
- The EUR/USD is probably building a bearish ABC (orange) pattern.
- The ABC (orange) should complete a wave B (yellow) of a larger ABC (yellow).
- The ABC (yellow) pattern could complete a wave 4 (pink).
- Price action could fall towards the deeper Fibonacci levels or the previous bottom.
- A bullish bounce could retest the resistance lines (purple) and 23.6% Fibonacci level.
- A bear flag pattern (gray lines) followed by a bearish break invalidates the bullish ABC and indicates an immediate downtrend.
(Click on image to enlarge)
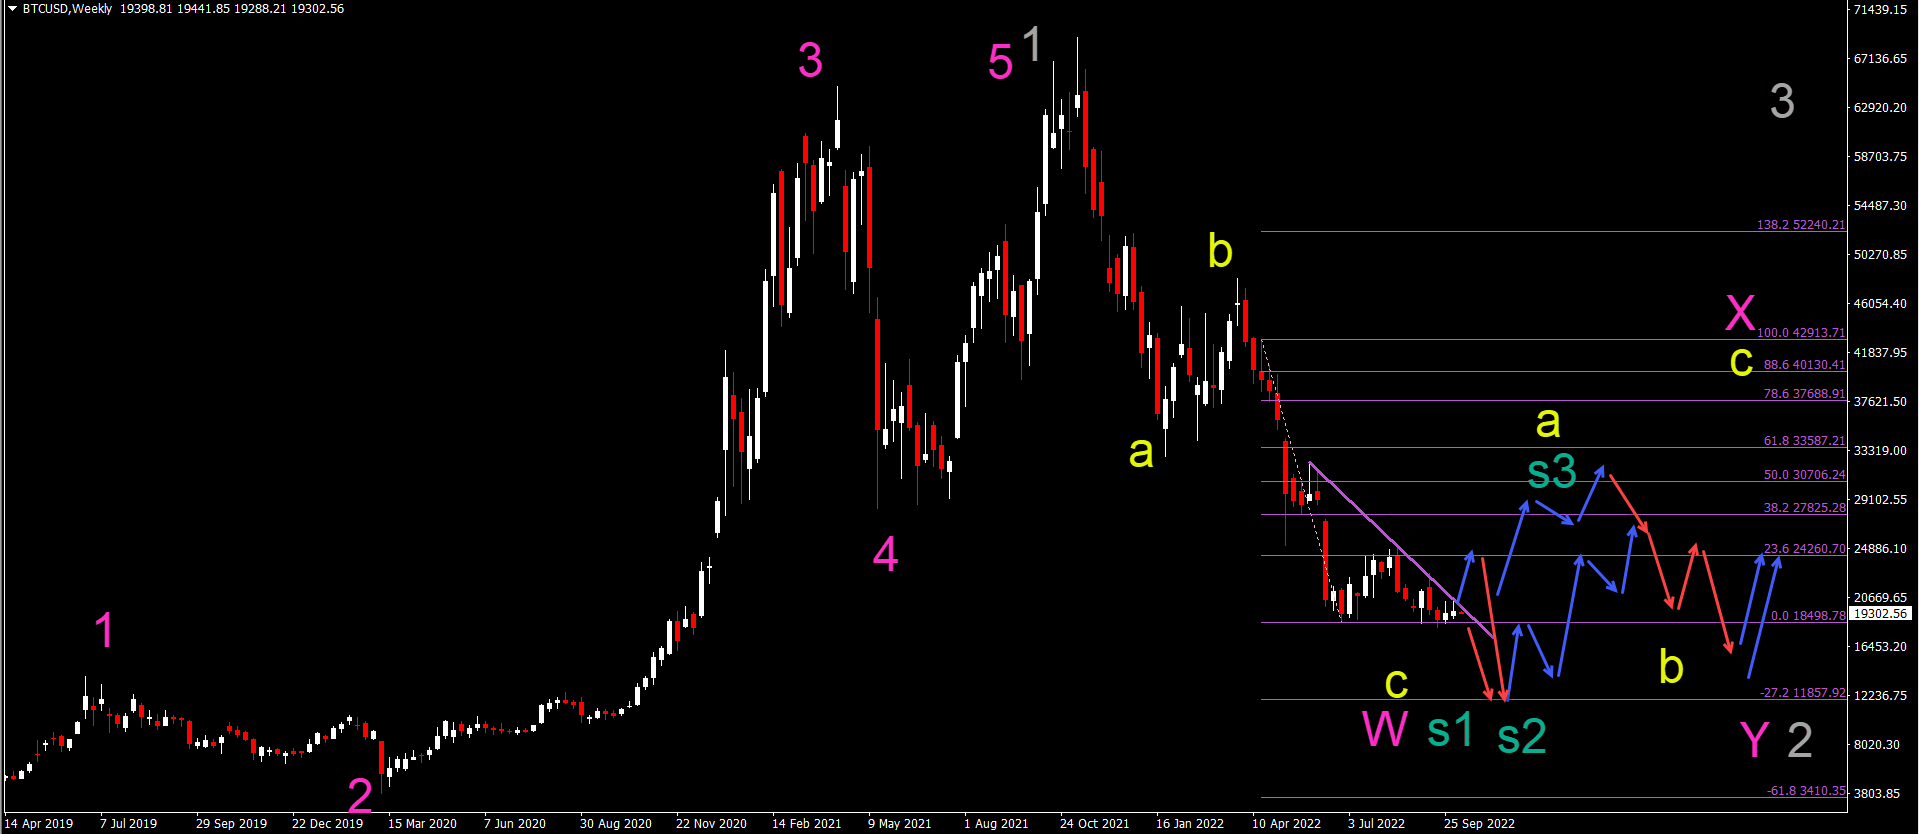
Bitcoin Testing Solid and Key Support
The BTC/USD (Bitcoin) is facing three different scenarios, which are indicated by s1, s2, and s3 (green):
- The first scenario (s1 green) is indicating an immediate bearish breakout towards the -27.2% Fibonacci target.
- The second scenario (s2 green) is indicating a retest of the resistance and then a bounce towards the same Fib target. Both s1 and s2 are part of wave C (yellow)
- The third scenario (s3 green) is indicating a larger bullish retracement within a wave A (yellow) of a larger wave X (pink).
- Eventually, the wave C (yellow) should complete a wave W (pink).
- A larger WXY (pink) correction is expected within wave 2 (gray).
(Click on image to enlarge)
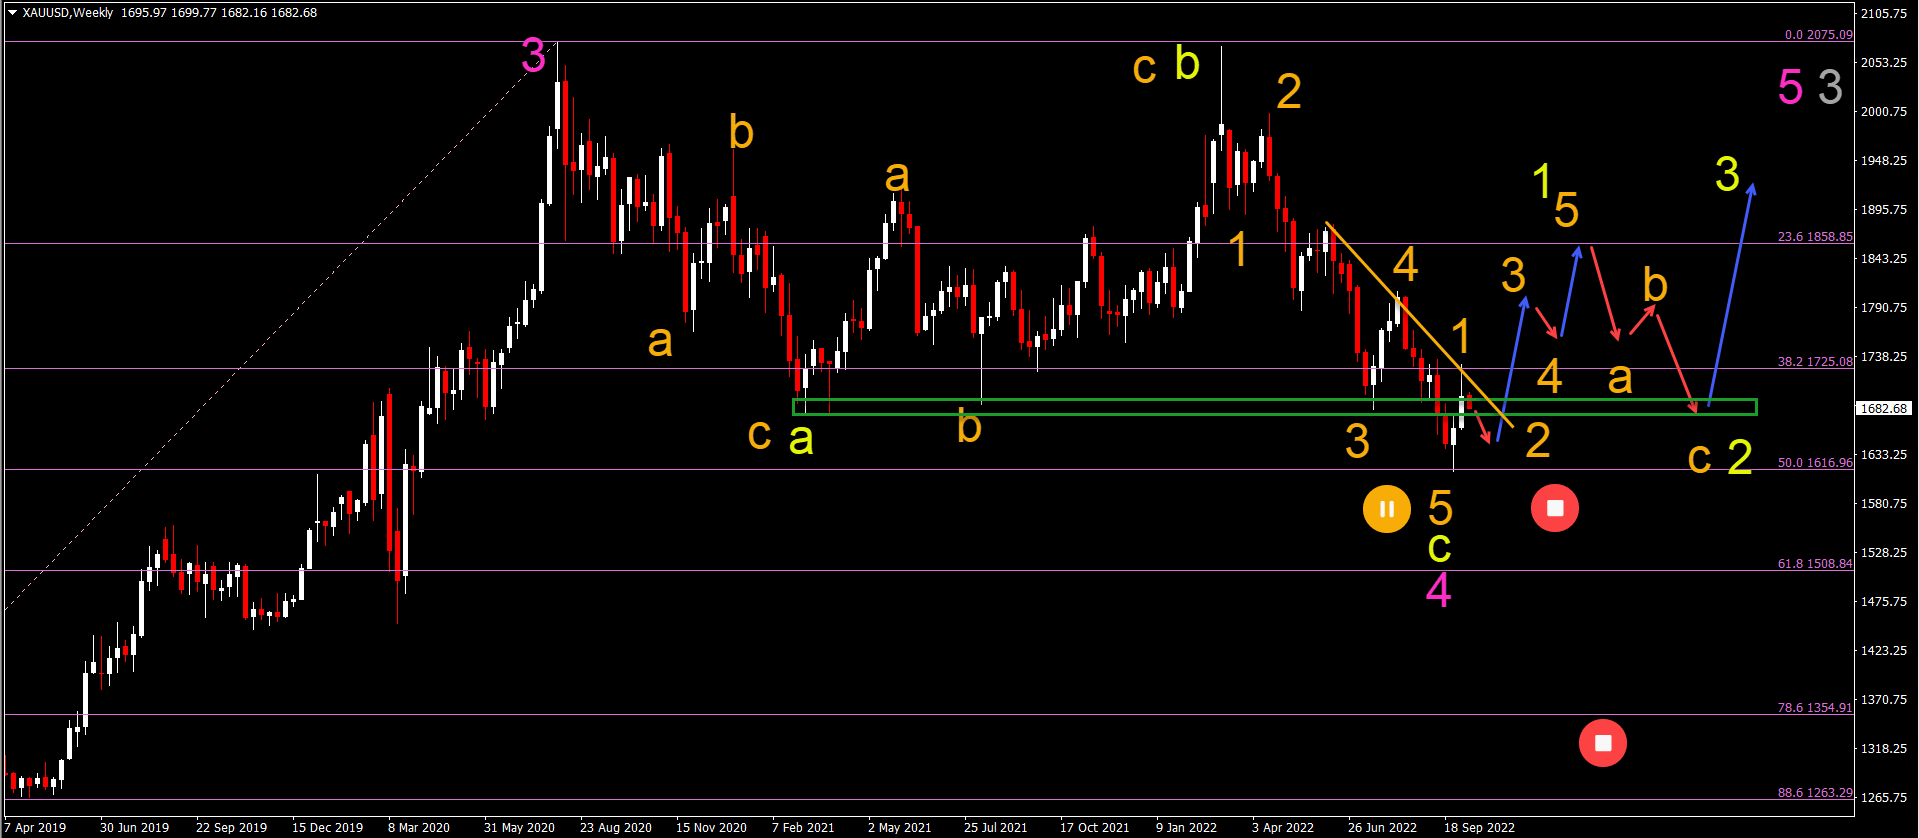
XAU/USD Bullish Bounce or Reversal at 50% Fibonacci
Gold (XAU/USD) has made a strong bullish bounce (reversal?) at the 50% Fibonacci retracement level:
- The Gold bounce at the 50% Fib could confirm the end of the wave 4 (pink).
- A larger wave 5 (orange) of a wave C (yellow) could have completed at the 50% Fib.
- The strong bullish bounce could be a wave 1-2 (orange) of a larger wave 1 (yellow).
- This bullish reversal could remain valid as long as price action stays above the bottom at the 50% Fibonacci level.
(Click on image to enlarge)
More By This Author:
How To Invest In UK Market TurmoilKey Market Insights September 2022
Bear Market: Five Thing To Keep In Mind
Disclaimer: CFDs are complex instruments and come with a high risk of losing money rapidly due to leverage. On average around 80% of retail investor accounts loose money when trading with high ...
more

