
Our weekly Elliott Wave analysis reviews the EUR/USD daily chart, the GBP/USD daily chart, and the Natural Gas 1 hour chart.
EUR/USD Reaches Key 38.2-50% Fibonacci Resistance Zone
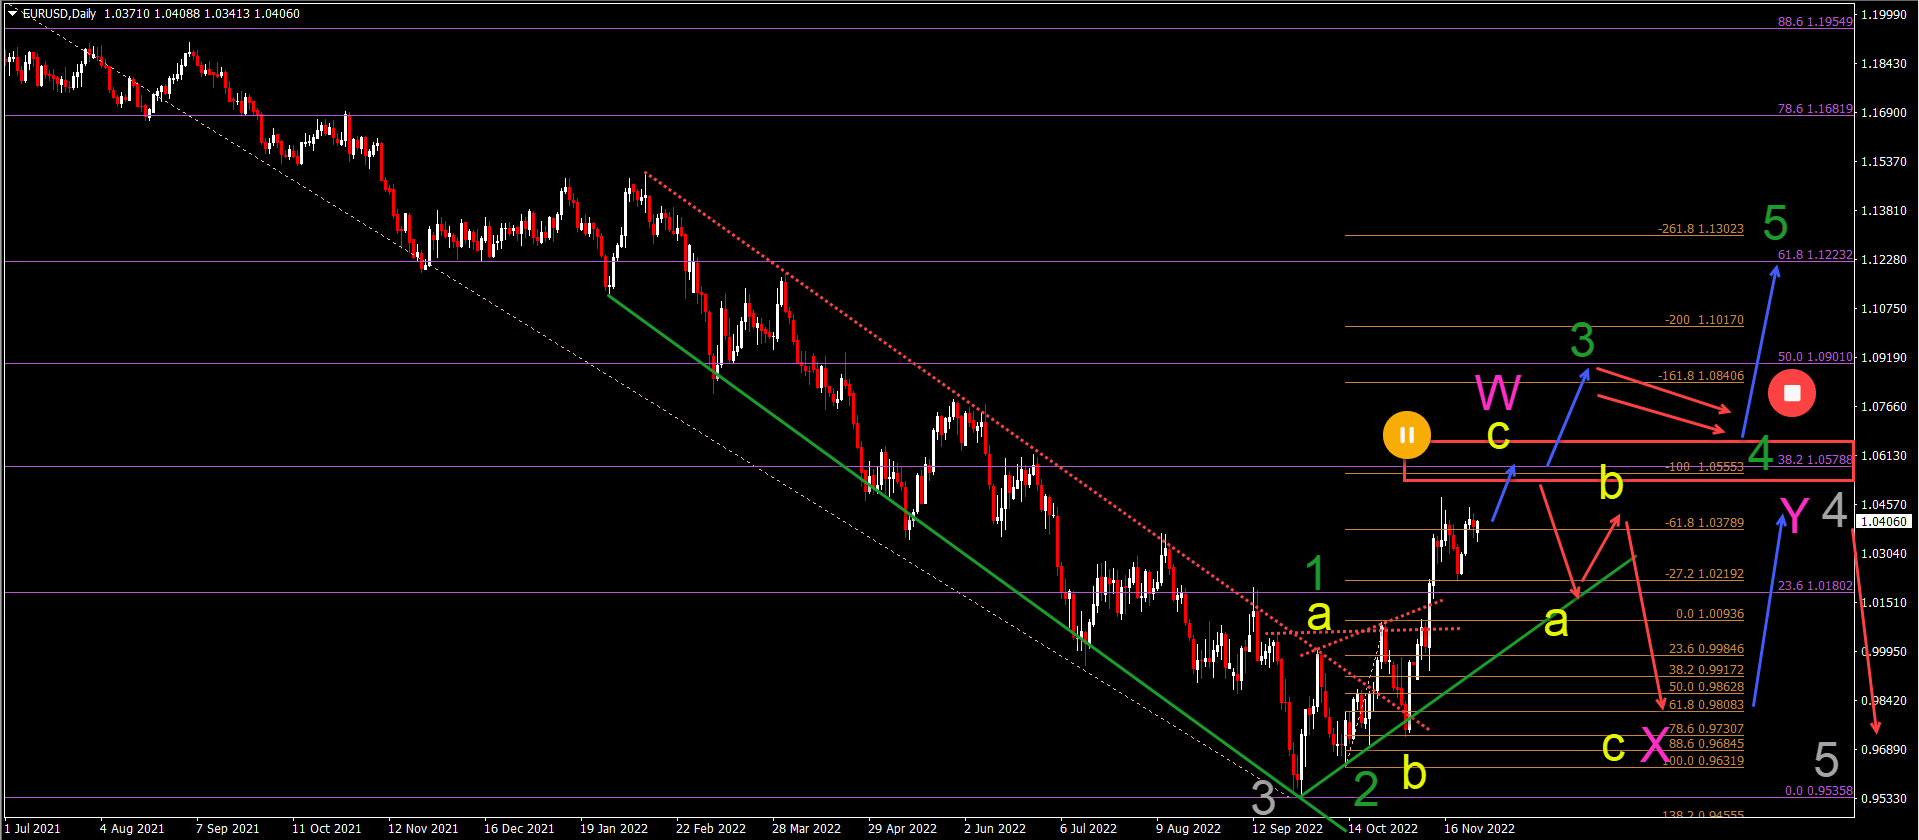
The EUR/USD is showing a short-term uptrend with higher highs and higher lows but what is the long-term picture? Let’s review:
- The EUR/USD made a bullish breakout above the resistance trend lines (dotted red).
- The EUR/USD is approaching a key resistance zone at the 38.2%-50% Fibonacci levels (red box) at the 1.05-1.0575 zone.
- A bullish breakout would indicate a larger bullish retracement such as a 12345 (green) pattern.
- A bearish bounce makes a different ABC (yellow) pattern possible within a complex WXY (pink) pattern of wave 4 (gray).
- The key pattern is the bull flag pattern after the bullish breakout, which makes a wave 4 (green) pattern likely.
(Click on image to enlarge)
GBP/USD Breaks Above Key 50% Fibonacci Level
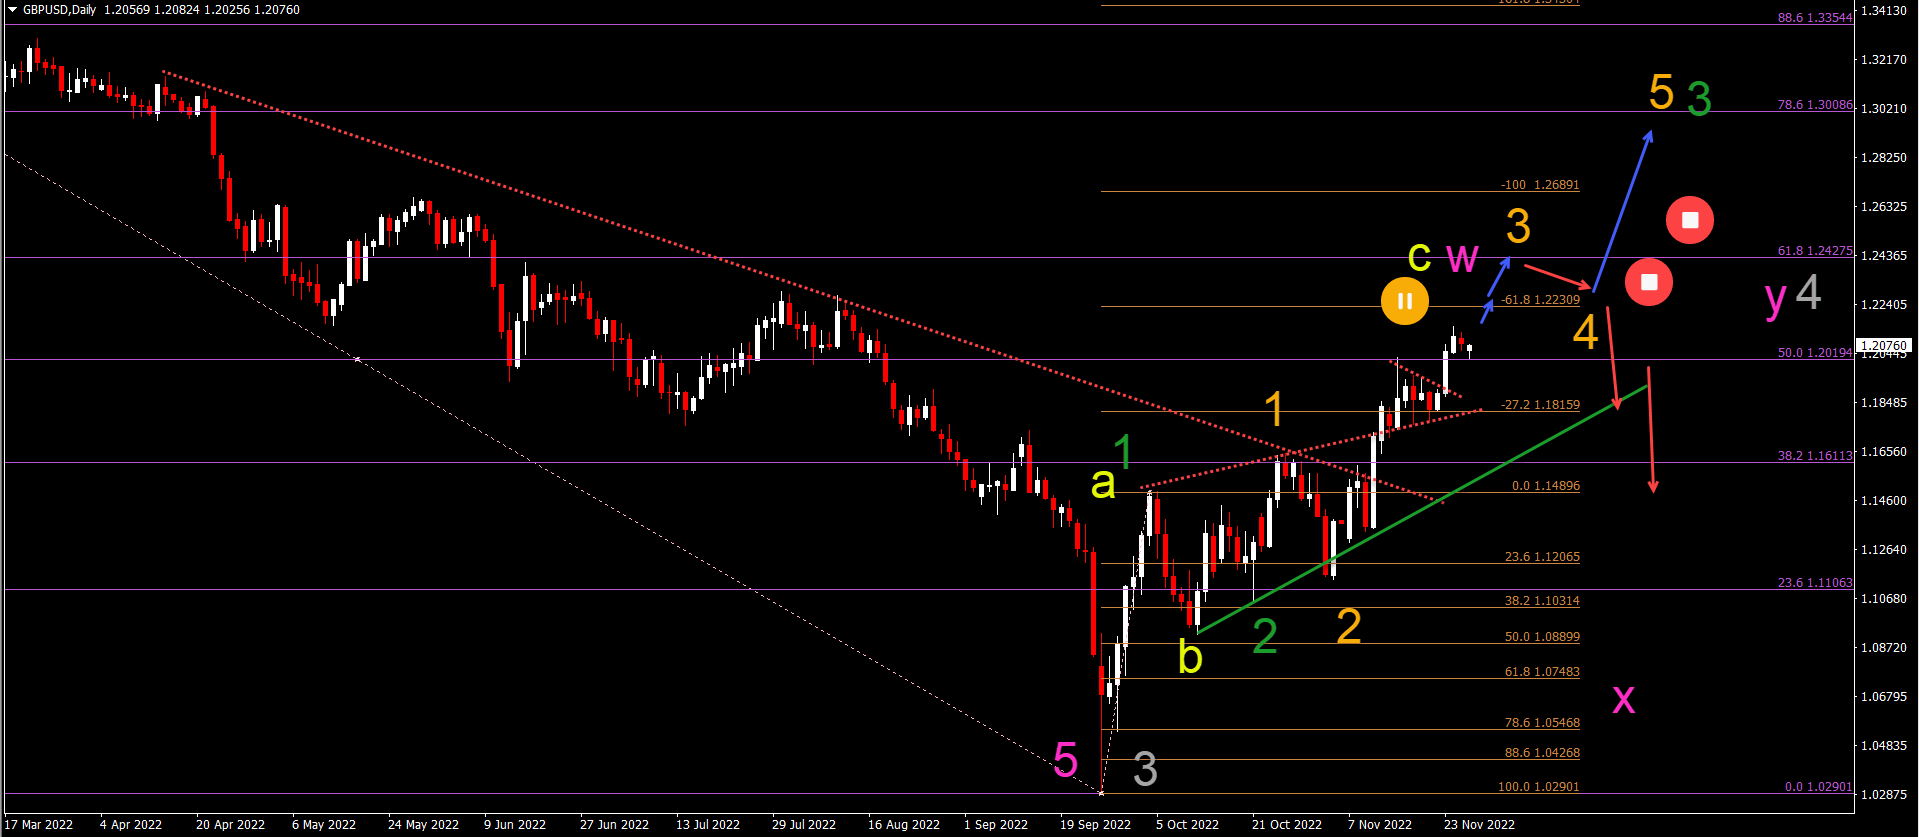
The GBP/USD is breaking above the 50% Fibonacci resistance level, which is undermining the long-term bearish wave analysis:
- The GBP/USD bullish breakouts above the resistance trend lines (dotted red) indicate a large bullish retracement.
- A bullish continuation followed by a bull flag pattern indicates a wave 345 (orange) pattern.
- A strong bearish bounce, however, could still indicate an ABC (yellow) within a complex WXY (pink) of a larger wave 4 (gray).
- The GBP/USD is at a key critical zone where price action is testing a bull-bear line. A break or bounce is critical for the next price swing.
(Click on image to enlarge)
NGAS Reaches Key -61.8% Fibonacci Target
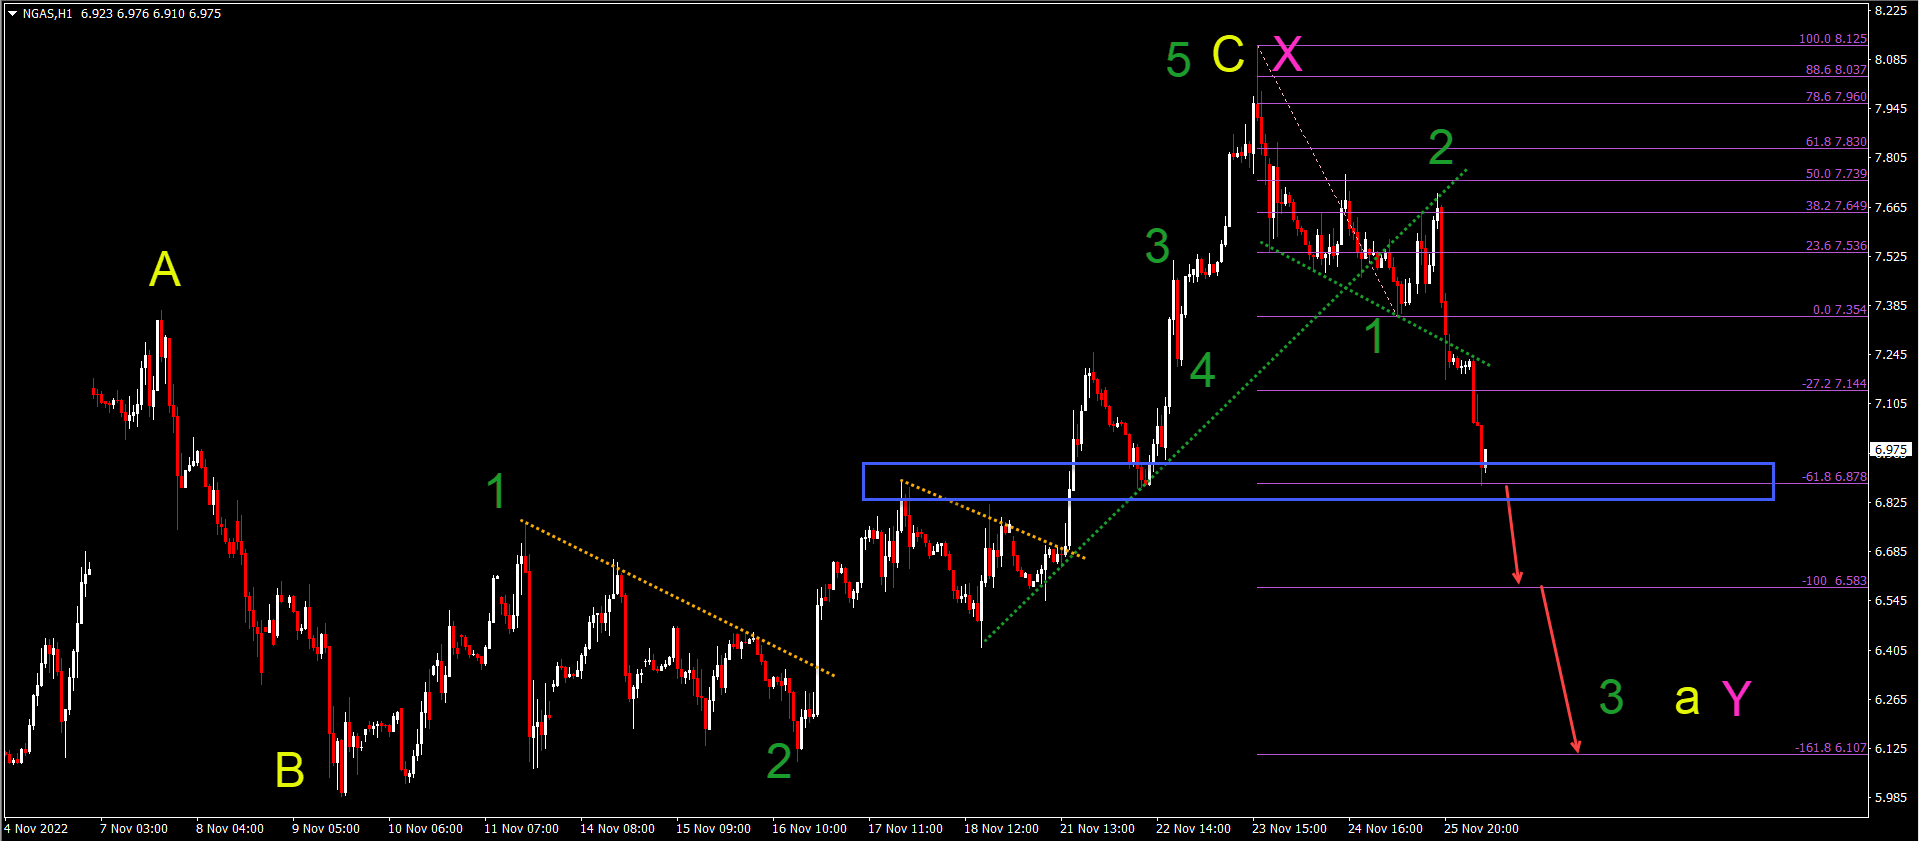
NGAS is back into a bearish mode after making a strong move up:
- The NGAS has completed a 5 wave pattern (green) in wave C (yellow) of a larger wave X (pink).
- Price action has reached the -61.8% Fibonacci target which is a key level.
- A bearish breakout below the support zone (blue box) could indicate a decline towards the Fibonacci targets.
- The bearish breakout could confirm a new bearish 5 wave pattern (green).
(Click on image to enlarge)
More By This Author:
Weekly Waves: EUR/USD, Bitcoin And US30 - Monday, Nov. 21
Impact Of Lower Inflations On USD Majors
Key Market Insights November 8


Comments
Log in or sign up to join the conversation.