
Our weekly Elliott Wave analysis reviews the EUR/USD daily chart, the GBP/USD monthly chart, and the NGAS daily chart.
EUR/USD Downtrend in Serious Danger of Reversal
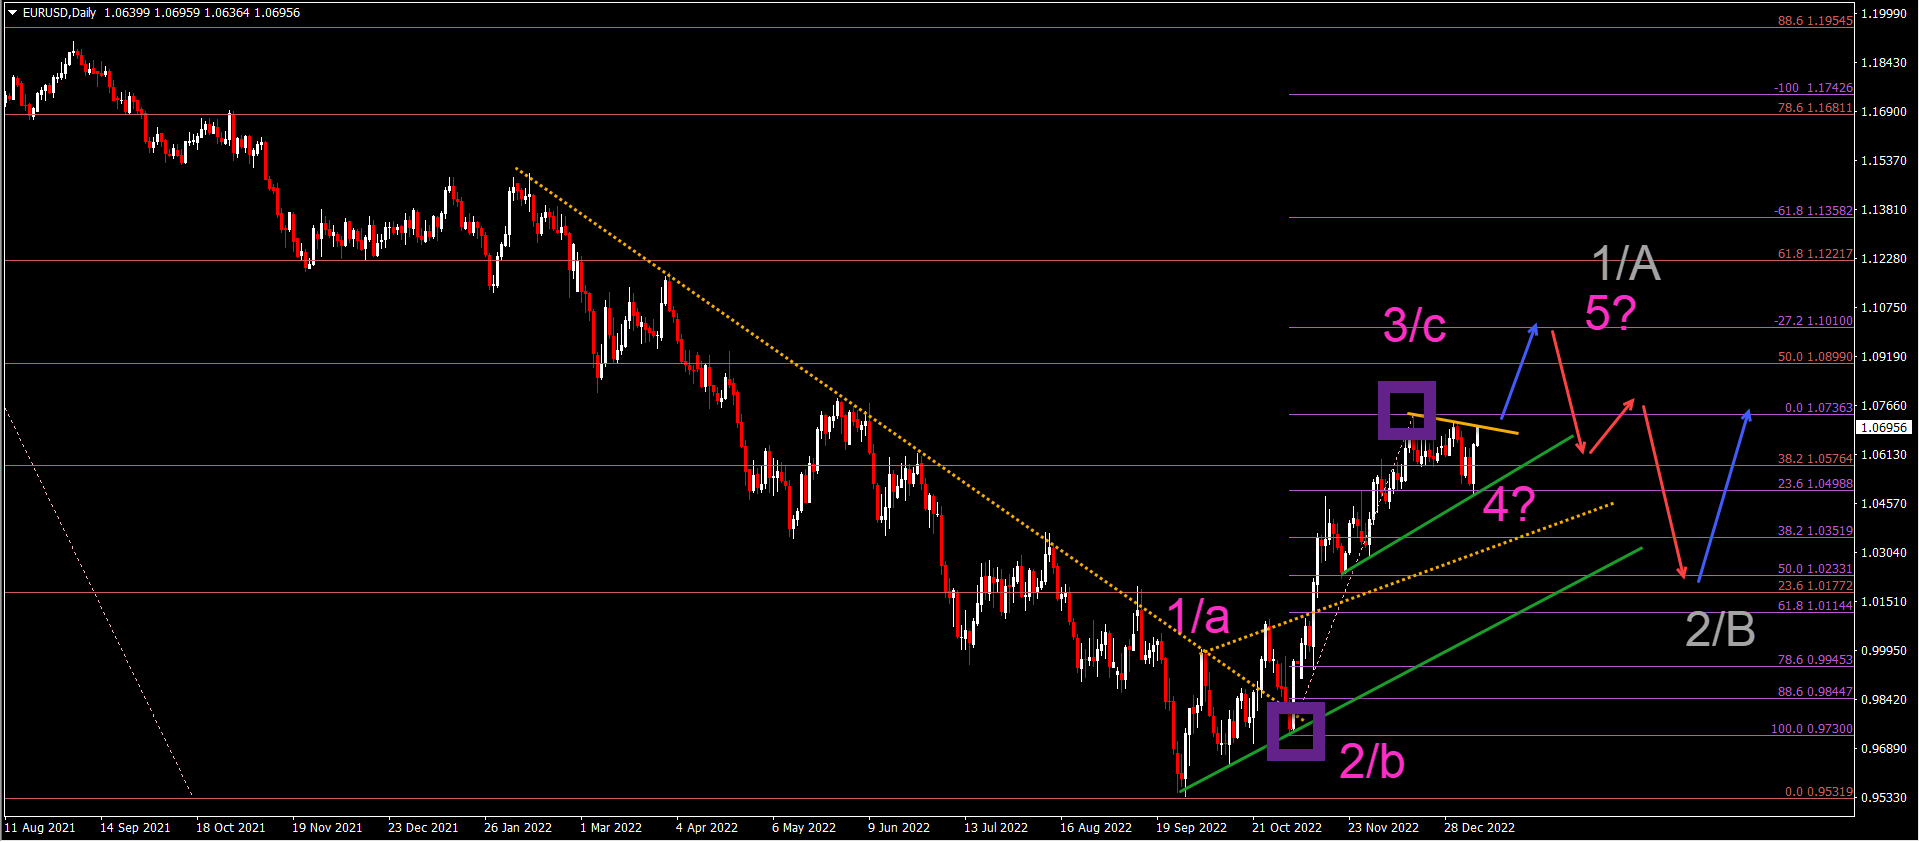
The EUR/USD has reached a critical spot, which will determine whether the long-term outlook remains bearish or whether the trend will switch to bullish:
- The EUR/USD is testing the key 38.2%-50% Fibonacci resistance zone (purple levels).
- But the bullish price action is surprisingly strong and impulsive, which indicates a potential wave 3 (pink).
- Until now we have labeled the bullish price swing as a wave C (pink), but the shallow corrective price action is indicating a wave 4 (pink) pattern.
- The shallow price action is because price has bounced at the 23.6% Fibonacci support level of the purple price swing.
- A bullish breakout (blue arrow) above the resistance (orange) could confirm a wave 5 (pink) of a larger wave A or 1 (gray).
- A breakout below the 38.2% Fibonacci support level (purple) of the wave 3 could indicate that the ABC (pink) correction is valid (not the 12345).
- If the price action does break north, then it could indicate the pause or end of a long-term downtrend and a larger bullish correction or uptrend.
(Click on image to enlarge)
GBP/USD Bears Losing Control of the Trend
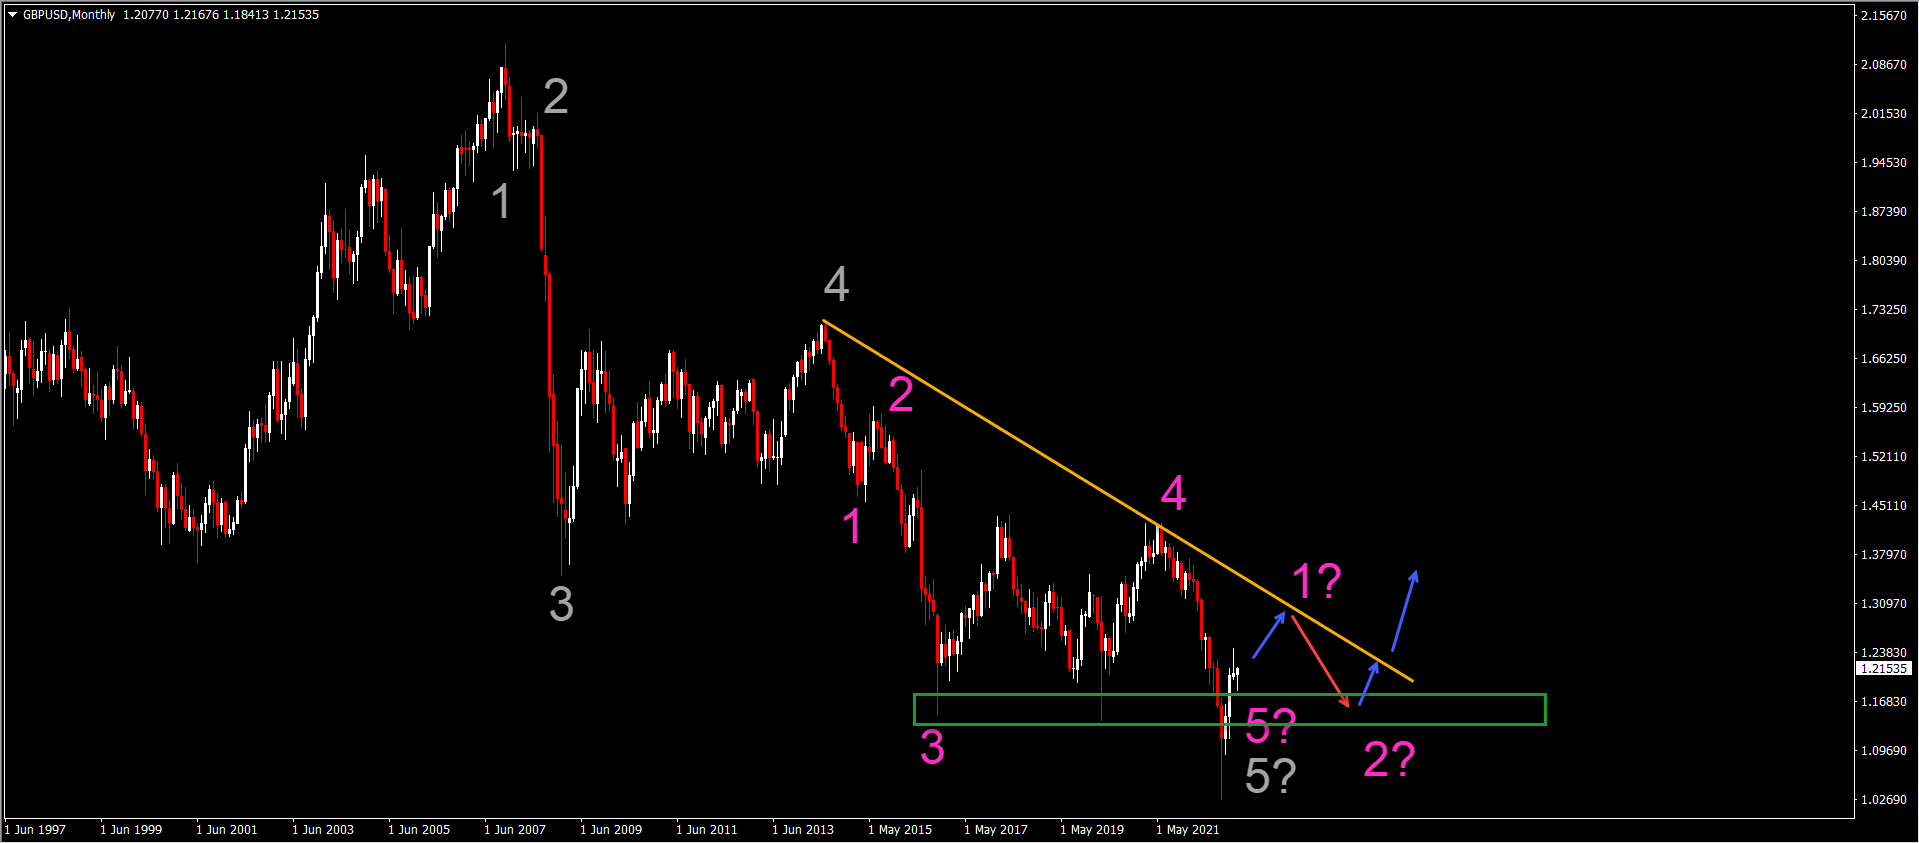
The GBP/USD is showing strong bullish price action as well. The strong monthly candlesticks are indicating that the Cable could go higher before finding resistance (orange line):
- The GBP/USD Elliott Wave count has remained bearish since the decline started at the top where wave 4 (pink) has ended.
- But the bullish price action followed by the weak bearish reaction could indicate that the downtrend might be finished.
- In that case, the lower low could complete a wave 5 (pink) of a wave 5 (gray).
- Another bullish push higher could confirm a wave 1 (pink), after which we expect a bearish wave 2 (pink).
- The support zone (green box) is expected at the previous lows, which could create a long-term inverted head and shoulders reversal chart pattern.
- The bearish outlook could remain intact if price action is able to break below the 1.17 support zone.
(Click on image to enlarge)
NGAS Falls Down Quickly in Bearish Impulse
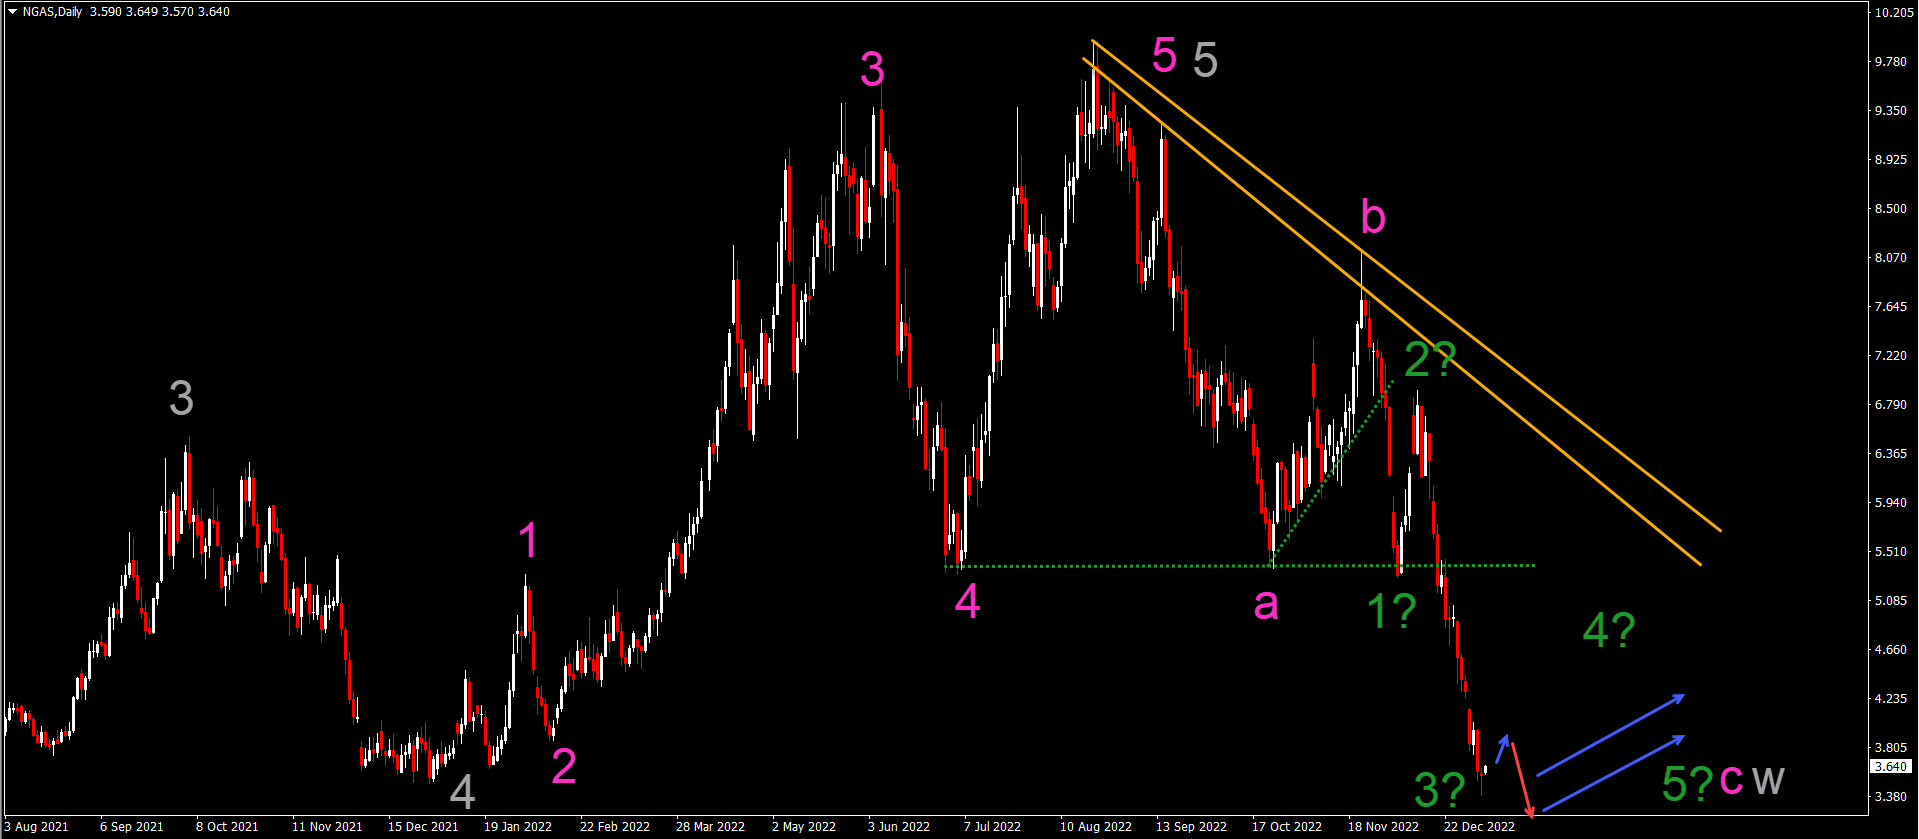
The NGAS chart has made a strong downtrend continuation – as we expected in our regular Elliott Wave updates on NGAS in 2022:
- The NGAS chart’s downtrend is expected to be a wave 3 (green) because of the strong impulsive decline.
- The wave 3 (green) could continue lower. A small retracement (blue arrow) could follow up with another bearish swing lower (red arrow) before the wave 3 (green) is finished.
- Eventually once the wave 3 (green) is completed, a larger bullish correction should emerge within a wave 4 (green).
- Usually waves 4 are complex and lengthy, but eventually a new push lower within the wave 5 (green) of wave C (pink) of a potential wave W (gray).
(Click on image to enlarge)
More By This Author:
How To Bet On A Chinese Recovery In 2023Weekly Waves: EUR/USD, US30 And Bitcoin - Mon., Dec. 19
Should You Be Around Tesla Stock After It Has Shed 60% Off Its Value In 2022?


Comments
Log in or sign up to join the conversation.