Weekly Forex Forecast – S&P 500 Index, Silver, Gold
Image Source: Unsplash
Fundamental Analysis & Market Sentiment
I wrote on 24th August that the best trades for the week would be:
- Long of the S&P 500 Index if we see a daily (New York) close above 6,471. This set up last Tuesday and ended the week lower by 0.16%.
- Long of Gold following a daily (New York) above $3,433 or $3,500 for more cautious traders. This did not set up until the end of the week.
- Long of Silver following a daily (New York) above $39.29 or $40 for more cautious traders. This did not set up until the end of the week.
Last week saw low volatility in markets as is typical during the month of August, especially the end of the month when many market participants are on holiday and liquidity thins out.
A summary of last week’s important data:
- US Preliminary GDP – this came in ahead of expectations, showing an annualized rate of 3.3% while only 3.1% as expected. This boosted the US stock market.
- US Core PCE Price Index – this remained stead month-on-month up by 0.3%, leading to now change in inflation expectations.
- Canadian GDP – this was lower than expected, although by a fine margin, showing a month-on-month decline of 0.1% when an increase by the same amount was widely forecasted.
- Australian CPI (inflation) – this rose quite sharply, from 1.9% to 2.8% annualised. An increase was expected, but only to 2.3%. This had the effect of boosting the Aussie as it makes rate cuts much less likely over the near term.
There was less directional volatility than has been usual over recent weeks. A quiet market got even quieter.
There were record highs in Silver and in the US S&P 500 stock market index. The US economy is seen as a bit stronger upon the higher GDP data, with some suggestions that the number may have even been boosted by Trump’s recent tariffs. We might see US stock indices advancing even further, or begin a serious correction if the Fed is increasingly seen as late on rate cuts.
The Week Ahead: 1st – 5th September
The coming week will almost certainly be busier, both in terms of high impact data points and in terms of liquidity and volatility. September sometimes brings major reversals and the start of new trends.
This week’s important data points, in order of likely importance, are:
- US Average Hourly Earnings
- US Non-Farm Employment Change
- US JOLTS Job Openings
- US ISM Services PMI
- US ISM Manufacturing PMI
- Australian GDP
- Swiss CPI (inflation)
- US Unemployment Rate
- Canadian Unemployment Rate
- US Unemployment Claims
Monthly Forecast September 2025
(Click on image to enlarge)

For the month of August 2025, I forecasted that the EUR/USD currency pair would rise in value.
I abandoned my forecast at a profit earlier in the month.

For the month of September 2025, I forecast that the EUR/USD currency pair will rise in value if we get a daily close above $1.1806.
Weekly Forecast 25th August 2025
I made no weekly forecast last week.
There were no unusually large price movements in currency crosses last week, so I have no weekly forecast this week.
The Australian was the strongest major currency last week, while the Euro was the weakest, although the overall directional movement was quite small. Volatility was low last week, with only one of the most important Forex currency pairs and crosses changing in value by more than 1%. Next week’s volatility is likely to increase as we start the new month of September and many of the world’s markets return to normal volumes after what tends to be a holiday month in August.
Monday is a public holiday in the USA and Canada.
Technical Analysis
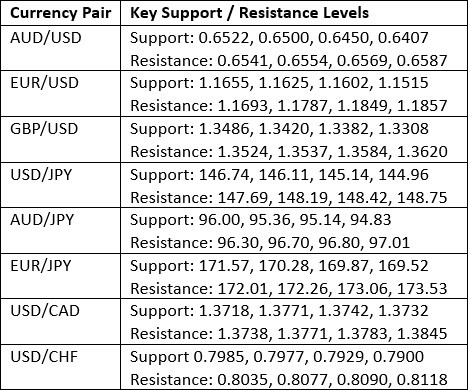
Key Support/Resistance Levels for Popular Pairs
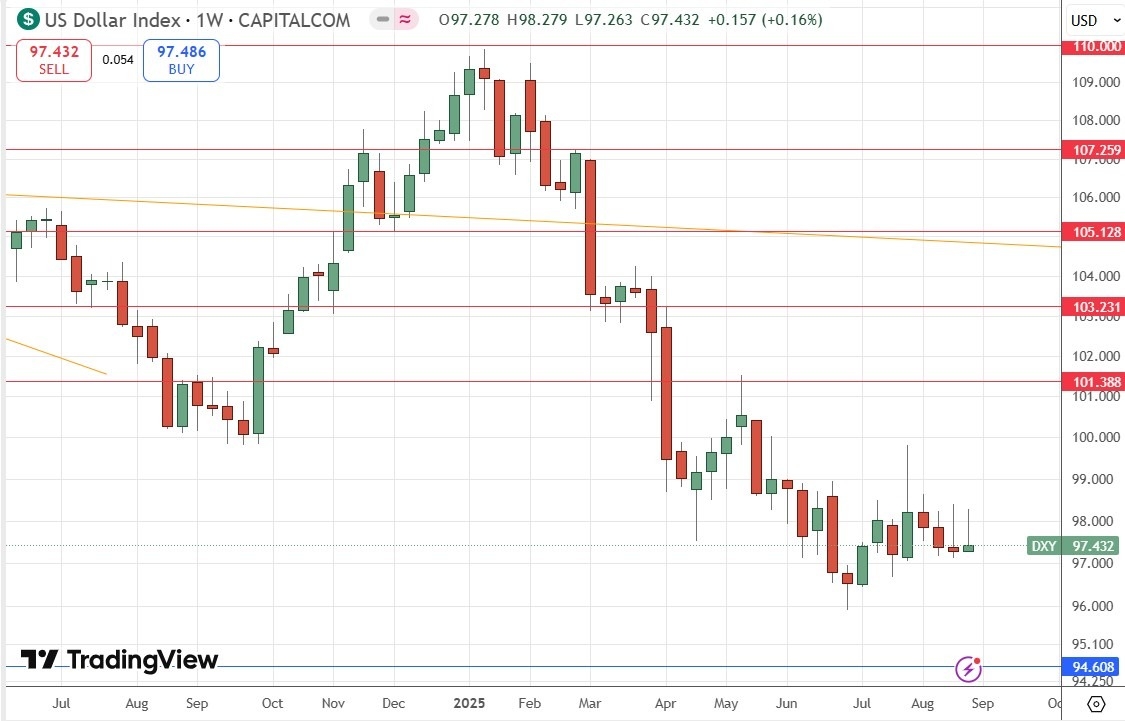
US Dollar Index
Last week, the US Dollar Index again printed a bearish pin bar which was also an inside bar, so this is bearish price action, and in line with the long-term bearish trend. Lower prices in the US Dollar look likely technically, however the price action is congested within its current area which may mean there is not much further downside to come.
It still seems the Fed is talking more hawkish than many in the market would like. The market is now expecting a rate but in September, overwhelmingly, but seeing only a 48% of a further 0.25% cut at the next FOMC meeting. So sentiment might be working against the trend and could be another factor in limiting downside.
Nevertheless, I think it is wise to trade with the long-term trend and short-term price action right now, so trades short and not long of the US Dollar will probably be a good idea over the coming week.
(Click on image to enlarge)
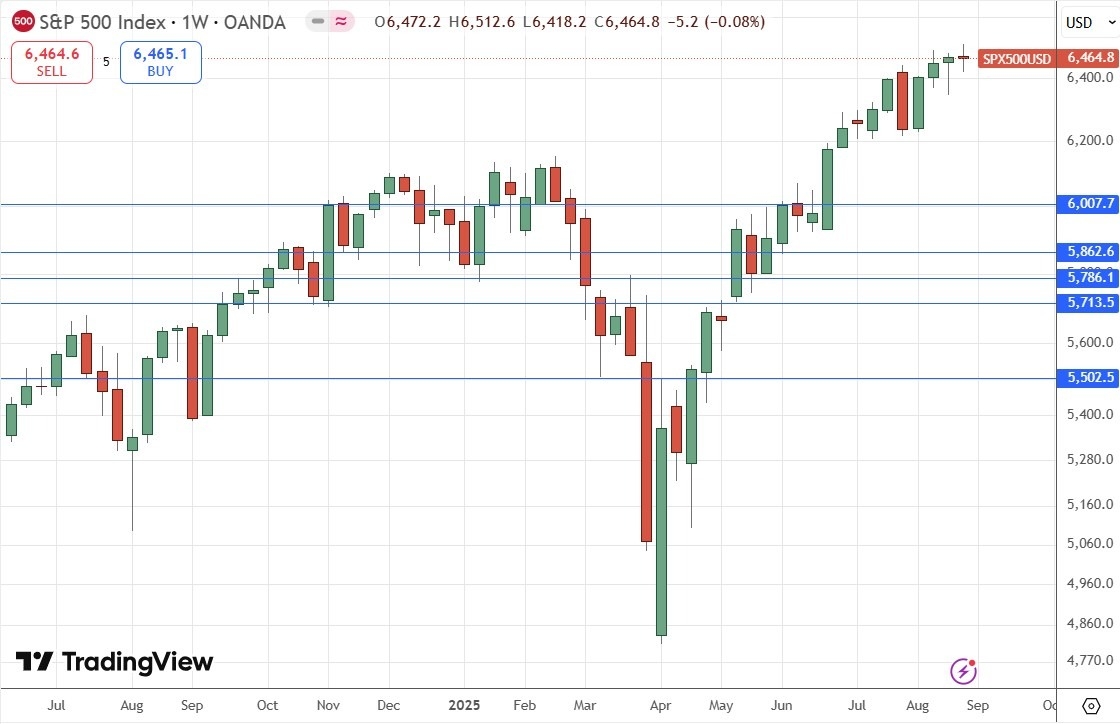
S&P 500 Index
The S&P 500 Index did not move much last week, and closed almost unchanged on the week, ending Friday just slightly below the weekly open, although it did make a new all-time high price.
The weekly candlestick is a small doji, which usually signifies indecision. This could be bullish or bearish.
The US stock market has risen by a lot in recent weeks, and it is not clear what will happen next week as the summer season ends and traders get back to their desks. The stronger than expected US Advance GDP of 3.3% annualized was enough to send the market higher, as initial signs are that Trump’s tariffs are not (yet) damaging economic growth.
For this reason, I would want to see a daily close above 6,515 which takes out the record high and convincingly ends the day above the big round number at 6,500 before entering a long trade, although last week’s long trade did technically set up at Friday’s close.
(Click on image to enlarge)
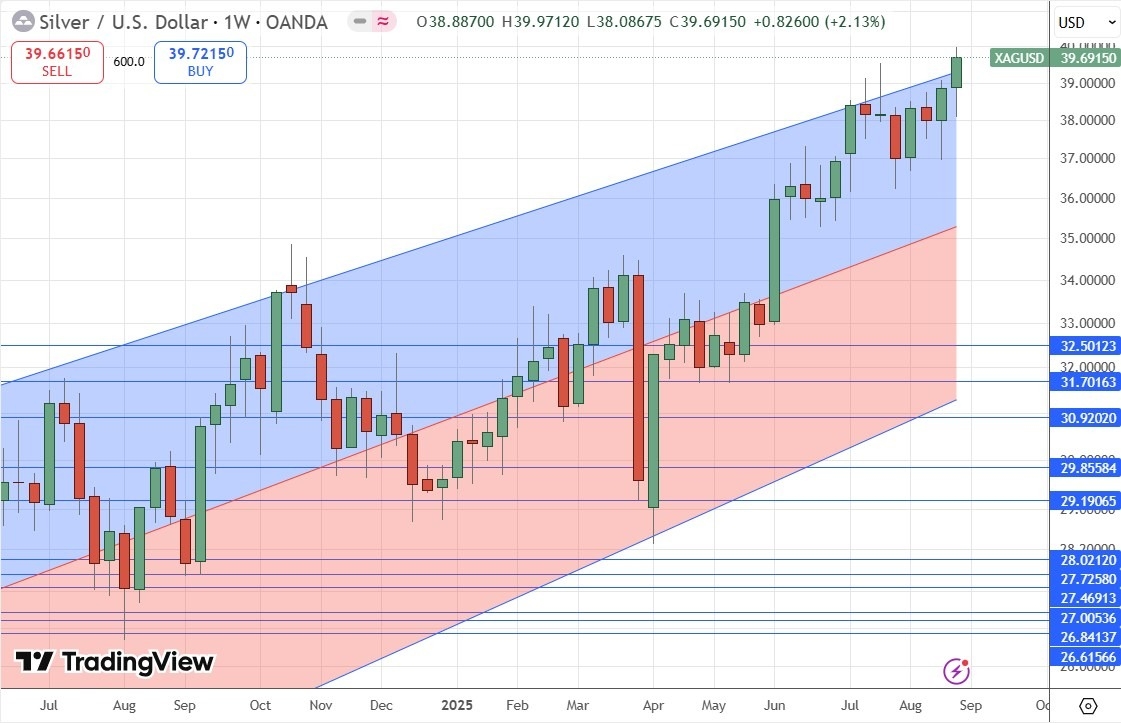
XAG/USD
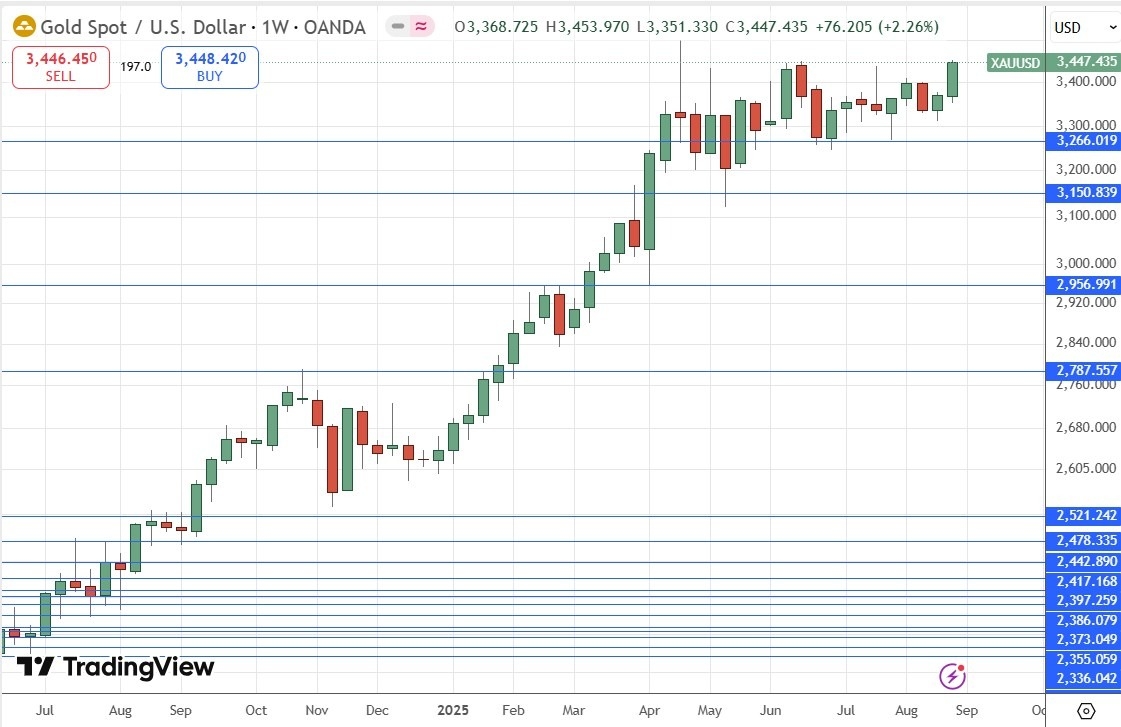
The two major precious metals, Silver and Gold, arguably made bullish breakouts from their medium-term consolidation ranges, although only Silver made a new record high.
The price action is Silver looks notably bullish, although it is also worth noting that the big round number just ahead of the high at $40 was not yet tested.
Silver looks like a stronger buy than Gold, so I would enter a long trade as the market opens this week without any qualification. It is also worth noting technically that the price is making a bullish breakout from an ascending linear regression channel, which is another bullish sign.
Very cautious traders might want to wait for a daily close above $40 before entering long, or to start now with a smaller than usual position size.
(Click on image to enlarge)
XAU/USD
Much of what I wrote about Silver above can also be applied to Gold. However, Silver looks a little more bullish technically as Gold has not made a new record high, which is confluent with a major round number at $3,500.
Nevertheless, the weekly chart below does show a persistent long-term bullish trend, and a very solid and bullish looking consolidation pattern building over recent weeks, which could be a reason to have more faith in this partial breakout.
More aggressive traders might want to enter a long position right away. More conservative traders might wait for a daily New York close decisively above $3,500 for spot Gold.
(Click on image to enlarge)
Bottom Line
I see the best trades this week as:
- Long of the S&P 500 Index if we see a daily (New York) close above 6,515.
- Long of Silver. For more cautious traders, only following a daily (New York) above $40.
- Long of Gold. For more cautious traders, only following a daily (New York) above $3,500.
More By This Author:
Forex Today: S&P 500 Inches To New All-Time High
ServiceNow Stock Signal: Should You Buy At Support?
The Best Oil Stocks To Buy Now
Risk Disclaimer: DailyForex will not be held liable for any loss or damage resulting from reliance on the information contained within this website including market news, analysis, trading signals ...
more


