Weekly Forex Forecast – Nasdaq 100 Index, S&P 500 Index, EUR/USD, USD/JPY, Cocoa Futures
Markets turned more bullish this week after the US Federal Reserve and the ECB hiked rates, but a softer landing for the US economy seemed to become more likely.

The difference between success and failure in Forex / CFD trading is highly likely to depend mostly upon which assets you choose to trade each week and in which direction, and not on the exact methods you might use to determine trade entries and exits.
So, when starting the week, it is a good idea to look at the big picture of what is developing in the market as a whole, and how such developments and affected by macro fundamentals, technical factors, and market sentiment. There are a few strong long-term trends in the market right now, which might be exploited profitably.
Fundamental Analysis & Market Sentiment
I wrote in my previous piece on 23rd July that the best trade opportunities for the week were likely to be:
- Long of the Nasdaq 100 Index if we got a bullish bounce from 15156.2 following a deeper bearish retracement. This did not set up.
- Long of the EUR/USD currency pair if we get a strong bullish bounce at a plausible supportive area. This did not set up.
- Long of the CC1! Cocoa Future. This ended the week higher by 3.37%.
My forecast produced an overall loss of 3.37%, averaging a win of 1.12% per highlighted asset.
Market sentiment is dominated by improved risk-on bullish sentiment as the dust settled following the two expected rate hikes last week by the US Federal Reserve and the European Central Bank. The US hike and language used has confirmed the consensus in its opinion that we have now seen the final rate hike of the current tightening cycle, leaving the terminal rate of 5.50%. The ECB’s hike was seen as a bit dovish due to language in the policy statement and at the press conference, which triggered a fairly strong selloff in the Euro, which until then had been showing relative strength. Although the Fed wasn’t overly hawkish, the US Dollar Index gained over the week.
The generally bullish sentiment on equities is strengthening, as fewer analysts see the US as likely to tip into a recession, and as corporate earnings data looks quite positive. The rally in stocks which began earlier this year was initially dismissed by many investors, but is now proven to be a real phenomenon, with the Nasdaq 100 Index up by more than 40% this calendar year, and the S&P 500 Index hitting a new 16-month high last week.
There is a stronger conviction that the US will manage to get inflation down without going into recession, backed by data last week showing US Advance GDP growing at a stronger than expected annualized rate (2.2% compared to 1.8%), and US Core PCE Price Index data showing a month-on-month increase of only 0.2%.
Markets will probably start the week continuing the risk-on rally, with stocks bid higher, but don’t expect the US Dollar to fall. The currency remains strong as investment pours into US markets.
Last week’s other key data releases were:
- Bank of Japan Policy Rate, Monetary Policy Statement, and Outlook Report – the bank kept rates negative, but announced it would loosen its yield curve control, causing some volatility in the Yen.
- US CB Consumer Confidence – this was a little better than expected.
- US Revised UoM Consumer Sentiment – this was a little worse than expected.
- US, UK, German, French Flash Services and Manufacturing PMI – these were worse than expected everywhere except the USA, leading to greater fears over recession in Europe.
- Australian CPI (inflation) data – fell to 5.4% as expected.
- Canadian GDP – month-on-month increase of 0.3% as expected.
- US Unemployment Claims – slightly better than expected.
- US Employment Cost Index– slightly worse than expected.
The Week Ahead: July 31 – August 4
The coming week in the markets is likely to see a higher level of volatility than last week, as there are three major central bank meetings scheduled. This week’s key data releases are, in order of importance:
- US Non-Farm Payrolls, Average Hourly Earnings, and Unemployment Rate
- Bank of England Official Bank Rate and Monetary Policy Summary
- US JOLTS Job Openings
- Chinese Manufacturing PMI
- Australian Cash Rate and Rate Statement
- Swiss CPI (inflation)
- US ISM Services PMI
- US Unemployment Claims
- US ISM Manufacturing PMI
- Canadian Unemployment Rate
- New Zealand Unemployment Rate
It will be a public holiday in Switzerland on Tuesday.
Technical Analysis
US Dollar Index
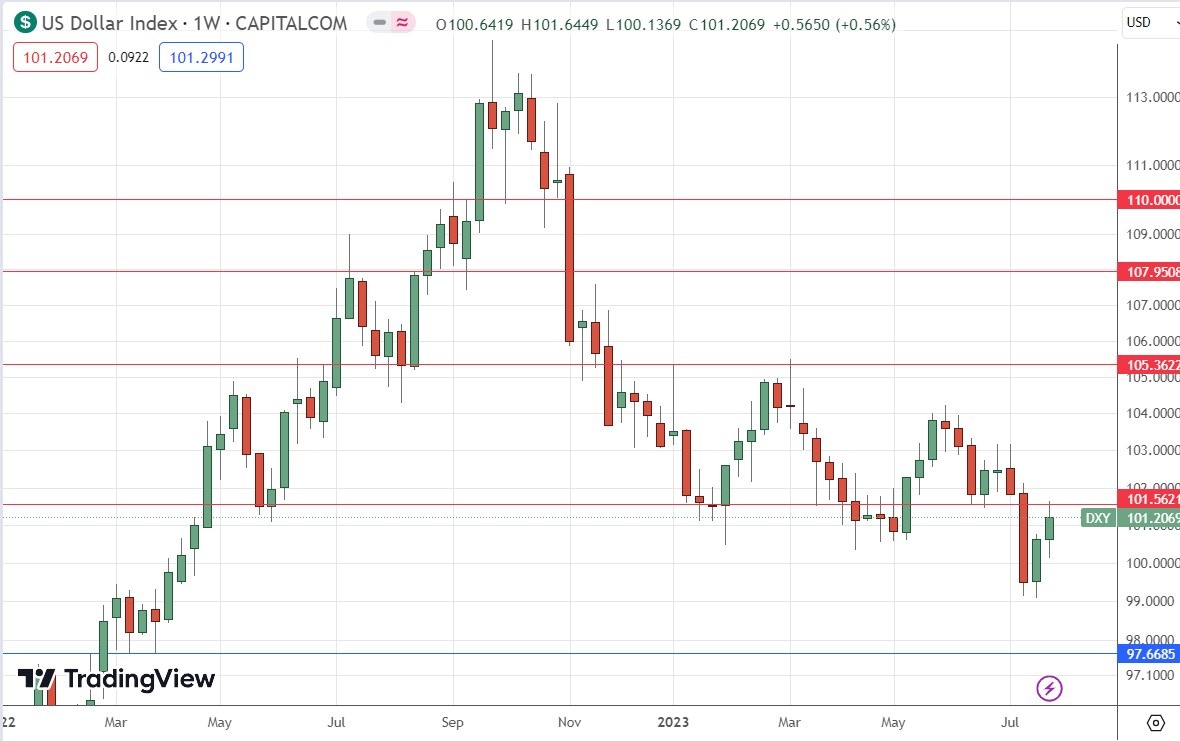
The weekly price chart below shows the U.S. Dollar Index printed a bullish candlestick last week after having fallen to a new 15-month low. However, the candlestick has plenty of upper wick and even more significantly, appears as if it might have printed a new lower resistance level at 101.56 which is shown within the price chart below.
Although the Dollar has shown some short-term bullish momentum, it should be noted that this is more to do with the relatively strong prospects for the US economy and stock markets which are becoming better established. Markets do not expect and further rate hikes from the Fed, and money is flowing into US markets, which seems to be the main factor pushing the US Dollar higher.
Despite the recent upwards movement, I think the long-term bearish trend should be respected here, so I prefer trading against the US Dollar this week.
Nasdaq 100 Index
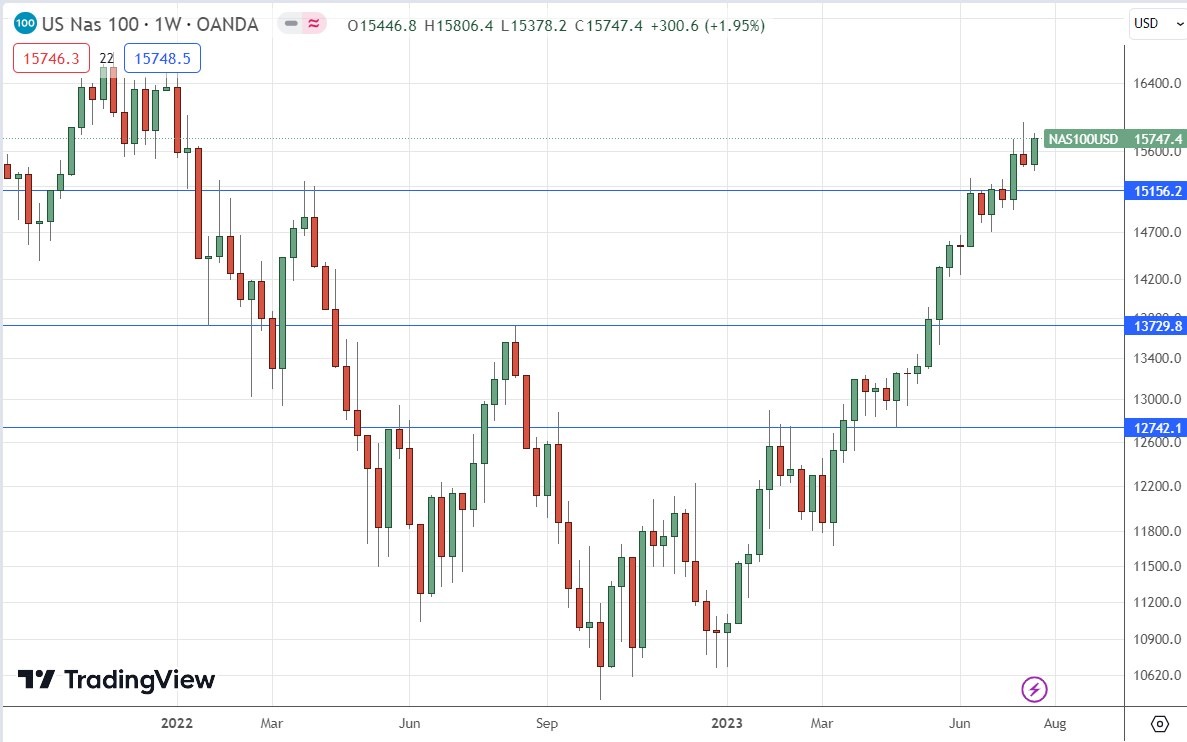
The previous week saw a small decline in the price of the Nasdaq 100 Index after reaching a new 18-month high. This week closed firmly up, printing a bullish engulfing candlestick that close near the long-term high. The candle closed very near the top of its range, and these facts are very bullish.
The price may be overbought and due a deeper retracement, but it is important to remember that there is a strong long-term bullish trend that has seen massive gains during 2023, when this Index has increased in value by approximately 40%.
The next thing to watch will likely be whether the price will continue to rise and make a new long-term high above the previous week’s high, which can easily be seen in the price chart below.
It may be wise to stand aside for the time being while we see how much deeper this retracement goes.
A bullish breakout with a strong daily close above 15938 could be a good entry opportunity to enter a new long trade.
S&P 500 Index
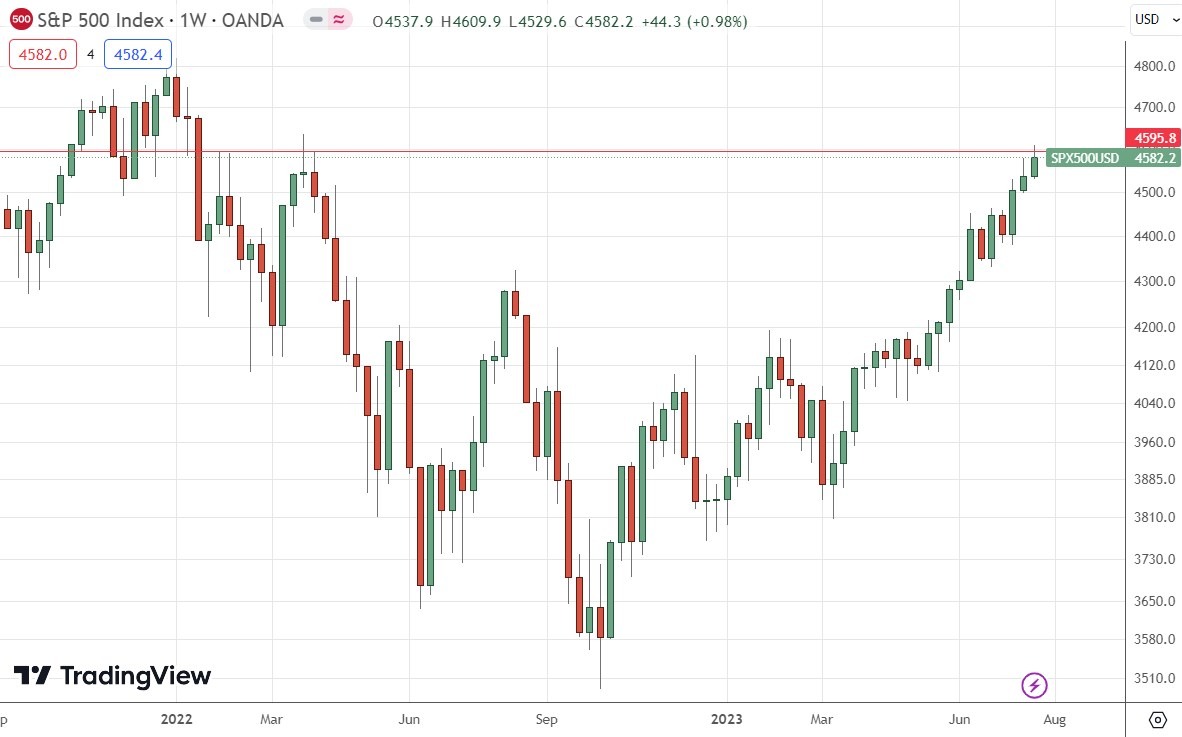
The major global equity index, the S&P 500, has risen for three consecutive weeks, making a new 18-month high. This week closed firmly up, printing a bullish candlestick that closed near the long-term high. The candle closed not far from the top of its range, and these facts are very bullish. However, bulls should beware of the rejection of the key resistance level at 4595.8 which can be clearly seen in the price chart below.
Stock markets are certainly rising strongly in the US as the US economy seems to be very well-positioned. This year has seen a strong rally, which was met with a lot of skepticism, but as the rally starts to become much broader, and as we see the S&P 500 begin to outperform the Nasdaq 100, we begin to see even more bullish signs.
The next thing to watch will likely be whether the price can make a daily close above the key resistance level at 4595.8.
A bullish breakout with a strong daily close above 4595.8 could be a good entry opportunity to enter a new long trade.
EUR/USD
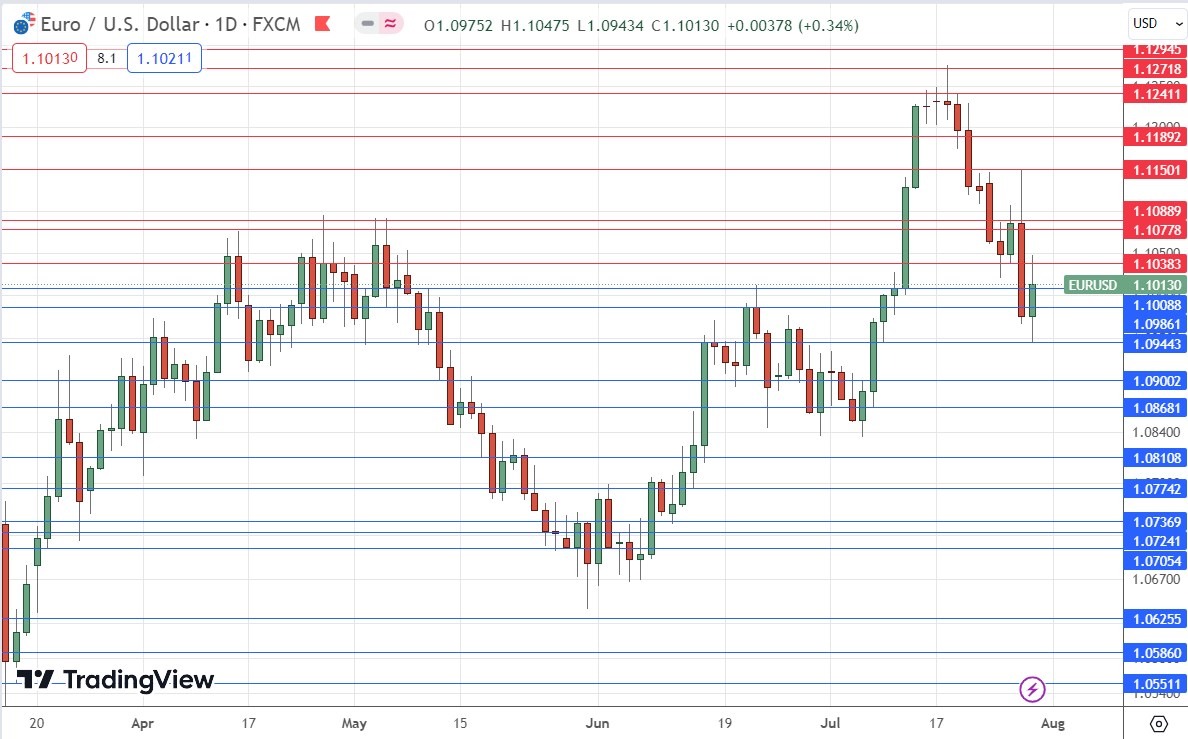
The EUR/USD currency pair fell last week, continuing its drop which began the previous week, which can be seen in the daily price chart below.
The Euro was hit with another selloff after the European Central Bank used more dovish language than expected in its policy statement, despite hiking its interest rate by 0,25% to 4.25% as was widely expected.
This currency pair loves to make deep pullbacks, but it seems to have fallen so far from its recent highs that the long-term bullish trend has probably been invalidated.
Although there are reasons to respect the long-term bearish trend in the US Dollar which is still valid, the Euro is not likely to be the right currency to be long of at this time, so I would avoid trading this currency pair for the next week.
USD/JPY
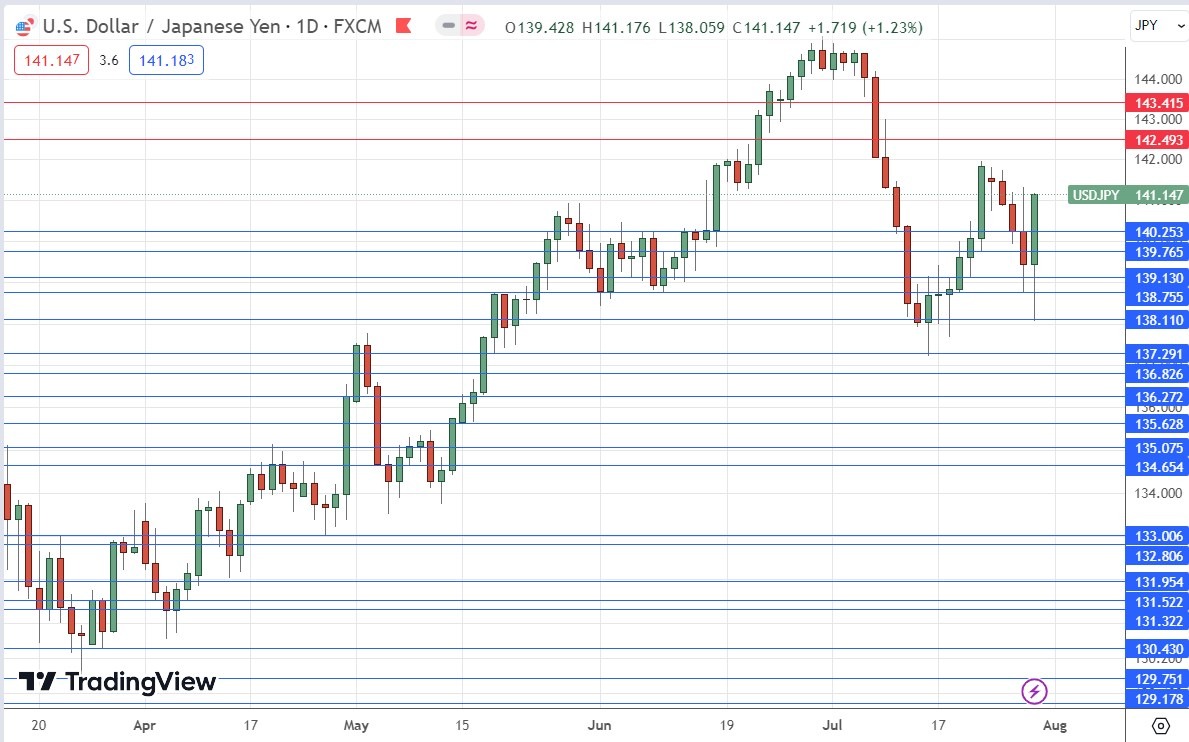
The USD/JPY currency pair rebounded strongly on Friday as the Bank of Japan announced it would loosen its yield curve control. This was not a complete surprise but was surprising enough to cause some volatility in the Japanese Yen.
It is hard to say what will happen with this currency pair in the short term. The Dollar is weak, but the Yen is prone to weakness also, so price movement can be very unpredictable here. I see the former long-term bullish trend here as having been invalidated.
This pair will likely be best suited to short-term trading opportunities based on sentiment and momentum.
Cocoa
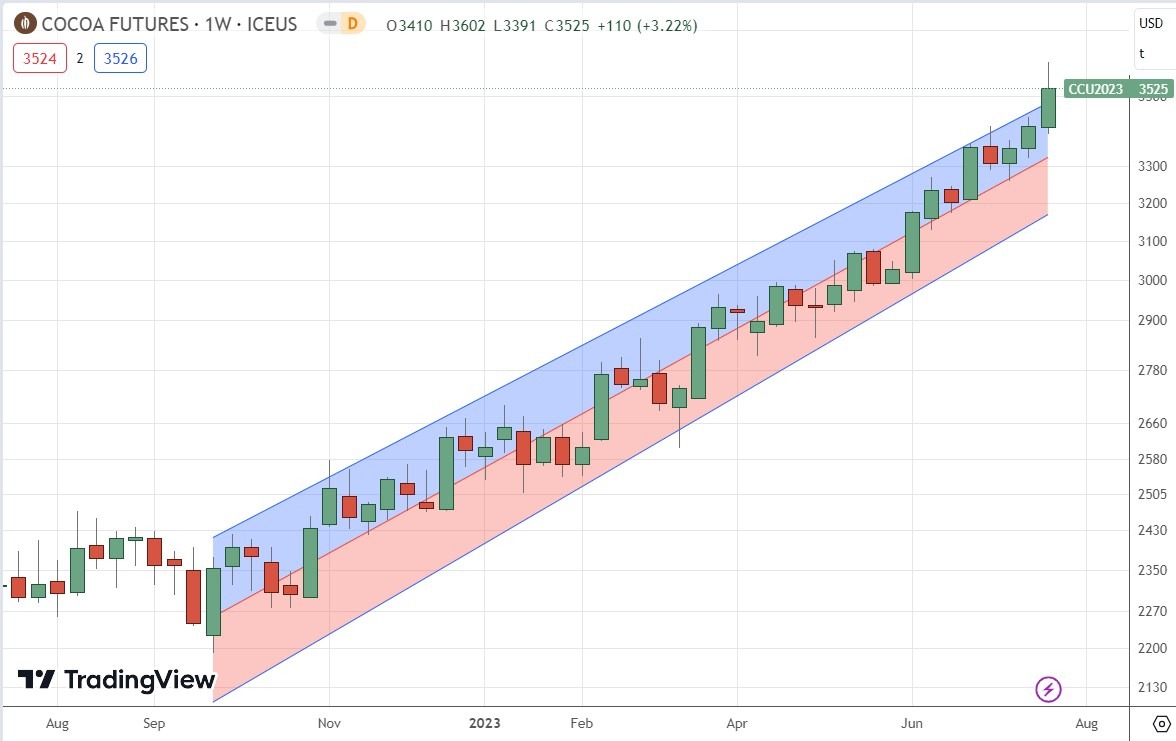
The price of Cocoa has been advancing strongly for a long time – since October 2022 – with a firm and predictable bullish trend. The price has risen by more than 50% during this period, which is a large rise.
The Cocoa futures price chart below shows a linear regression analysis study applied to the trend since October, showing the price action is very predictable and has remained within the regression channel, even breakout out above the channel’s upper trend line last week. This is suggestive of a persistent bullish trend.
The price rose last week and broke to a new significant multi-year high price. This is a bullish breakout and might be a good signal to enter a new long trade.
There is strong global demand for cocoa and problems with some crops in Africa which are helping to drive the price higher.
Cocoa futures remain a buy, but after two days of lower closes at the end of last week, I will wait for an up day first.
Bottom Line
I see the best trading opportunities this week as:
- Long of the Nasdaq 100 Index if we get a daily close above 15938.
- Long of the S&P 500 Index if we get a daily close above 4595.8.
- Long of CC1! Cocoa Future following a daily close above 3525.
More By This Author:
BTC/USD Forex Signal: Rising Within Descending Channel
ECB and Fed Hike Rates by 0.25%
BTC/USD: Shifting Behavioral Sentiment Near Crucial Support
Disclosure: DailyForex will not be held liable for any loss or damage resulting from reliance on the information contained within this website including market news, analysis, trading signals ...
more


