
USDX: Subtle Changes, Remarkable Outcomes
Even the smallest moves can be of utmost importance to a number of investors. This time, the USDX was the one to give a subtle nod to the upcoming changes.
In yesterday’s analysis, I wrote about the subtle, yet very important short-term detail that likely indicated a major turnaround in the USD Index. This is huge news for the precious metals investors, as a major turnaround in the USDX (and the subsequent rallies) would be very likely to translate into a severe price slide.
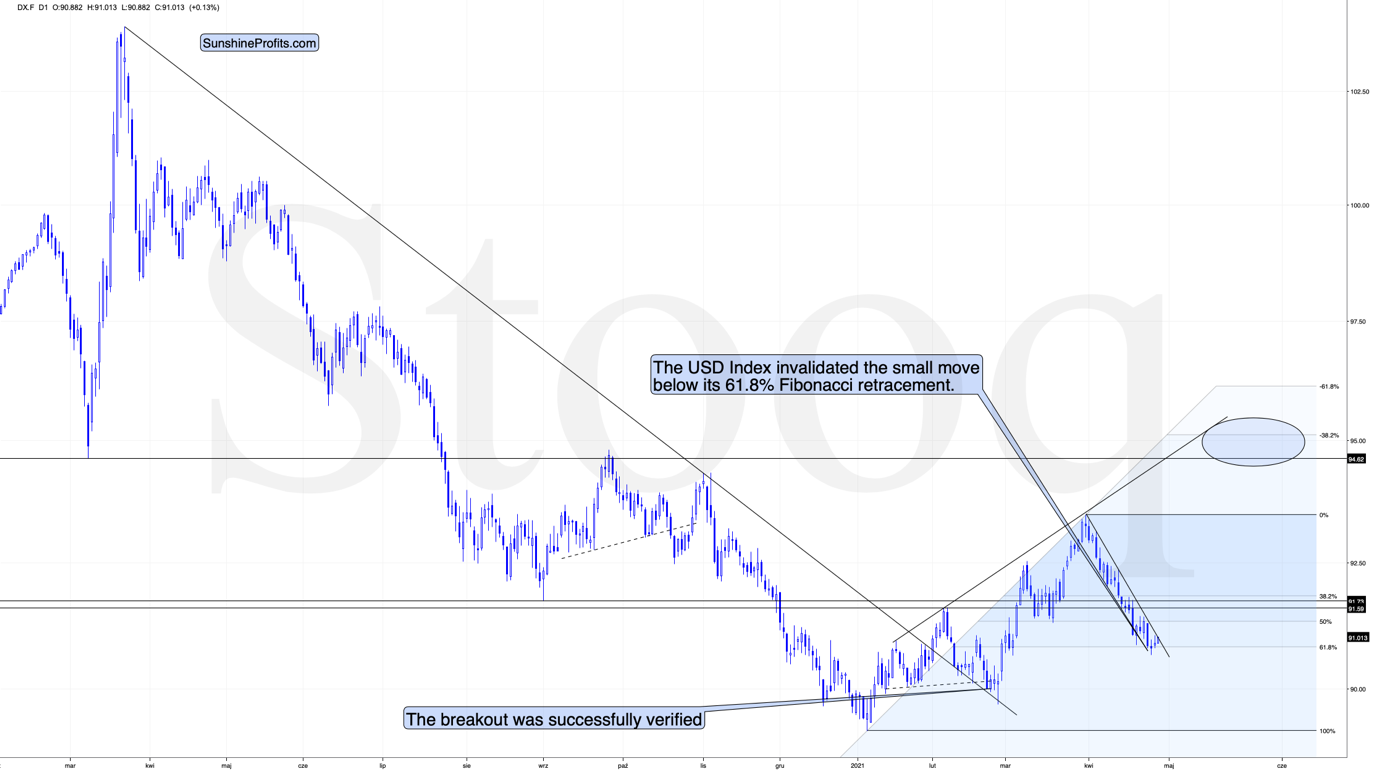
The important change was that the situation regarded the USD’s 61.8% Fibonacci retracement.
Last week, I wrote the following:
I wouldn’t be surprised to see this weekend without any major reversal, but we could see one on Monday. Some traders won’t be able to adjust their stop-loss levels at that time, so if anyone “big” wants to squeeze the profits out of individual traders shorting the USDX before the latter rallies, it would be a perfect time. The idea could be to trigger a small sell-off early on Monday, which would then trigger stop-loss selling, and it would allow the “big” market participant to re-enter the long positions at lower prices.
The fact that the USD Index moved slightly below its very important short-term support (the 61.8% Fibonacci retracement) on Monday (Apr. 26) and then it invalidated this breakdown yesterday (Apr. 27) perfectly fits the above quote.
The invalidation of the breakdown is a bullish phenomenon, and even though the price moves are still small, they already suggest that a bigger rally is likely just around the corner. In today’s pre-market trading, the USD Index moved higher once again, which means the invalidation was not accidental.
If we zoom in, we’ll see the full importance of what just happened on a short-term basis.
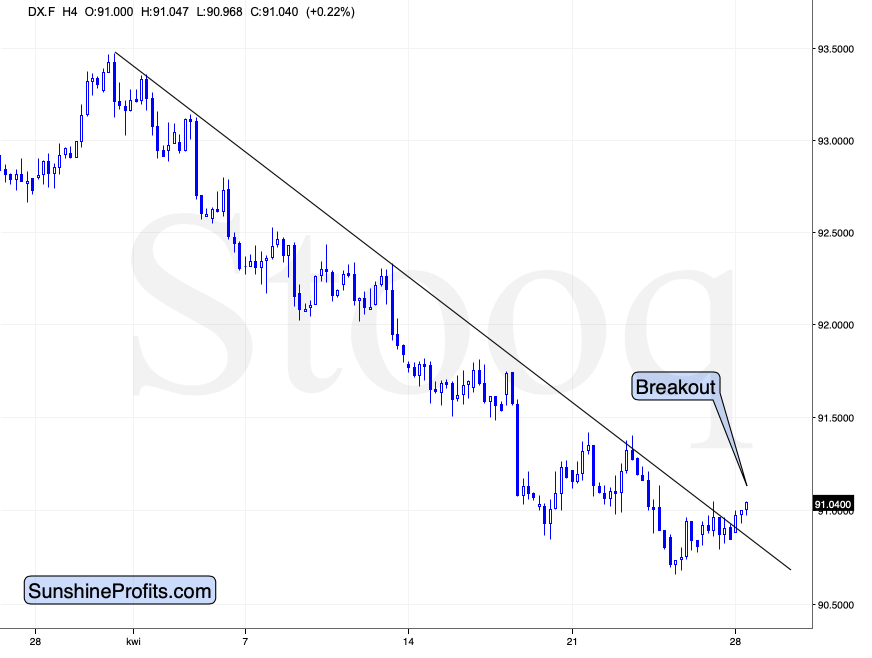
We just saw a short-term breakout! Finally, after many days of declines, the USD Index showed enough strength to rally above its short-term declining resistance line.
This is yet another sign that the recent price action – despite not being very visible – is a game-changer for the short term.
Naturally, the bullish situation in case of the USD Index has bearish implications for the precious metals market.
In fact, we can see the implications on the gold market already.
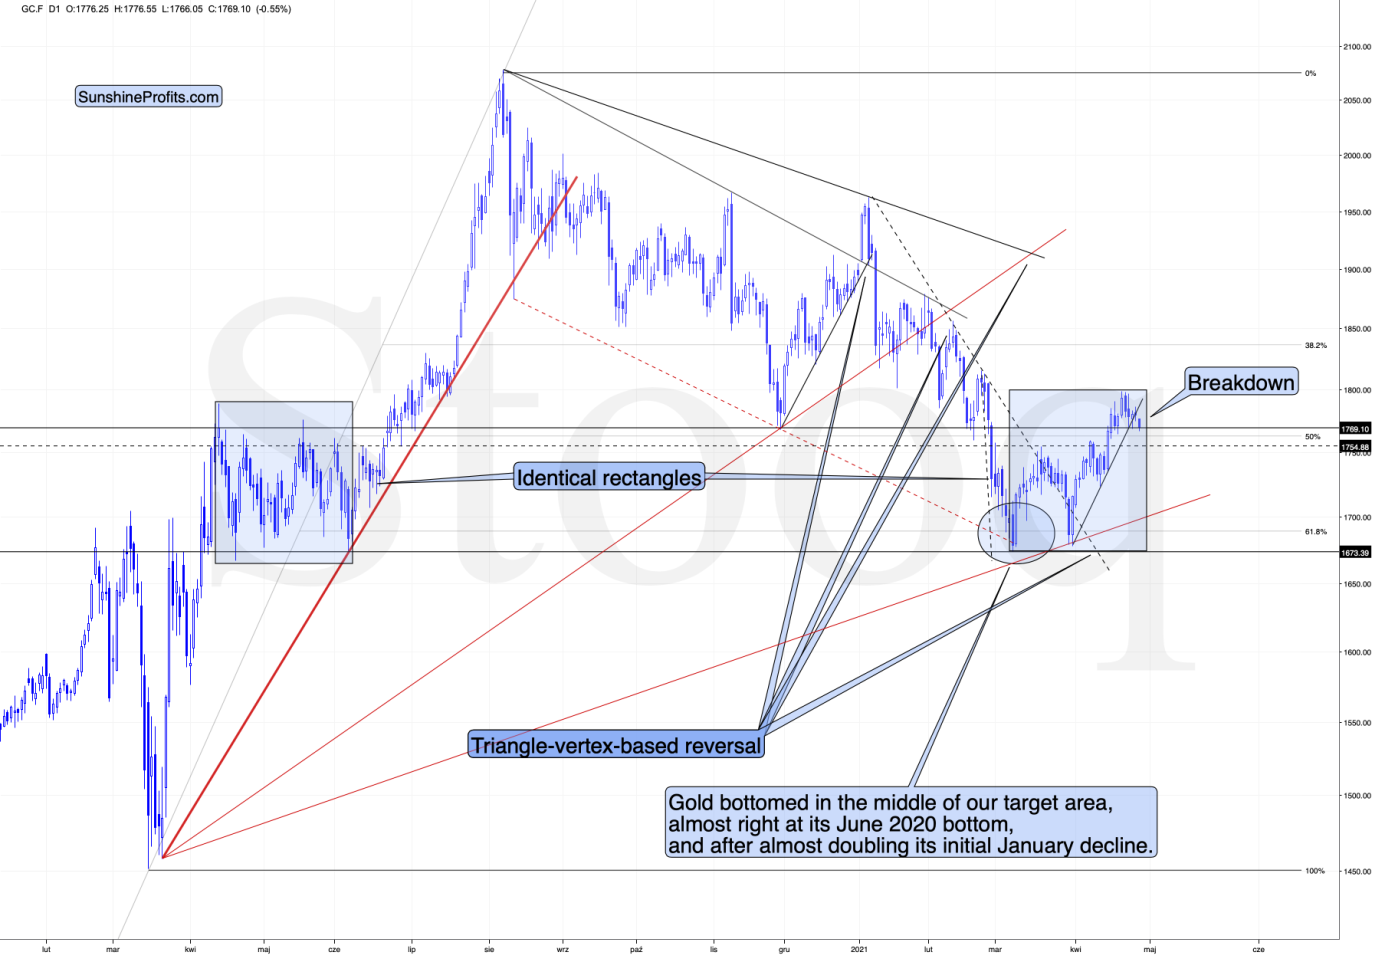
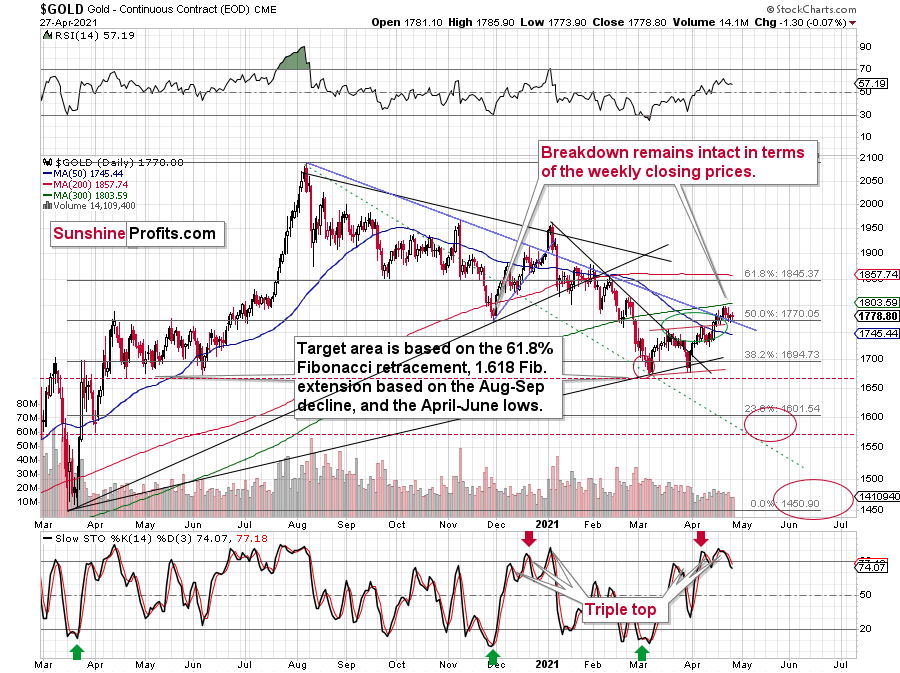
As the USD Index broke higher, gold broke below its rising support line, and at the moment of writing these words, it’s already trading below the $1,770 level. The odds that the final top was formed last week – at $1,798.40 – have further increased.
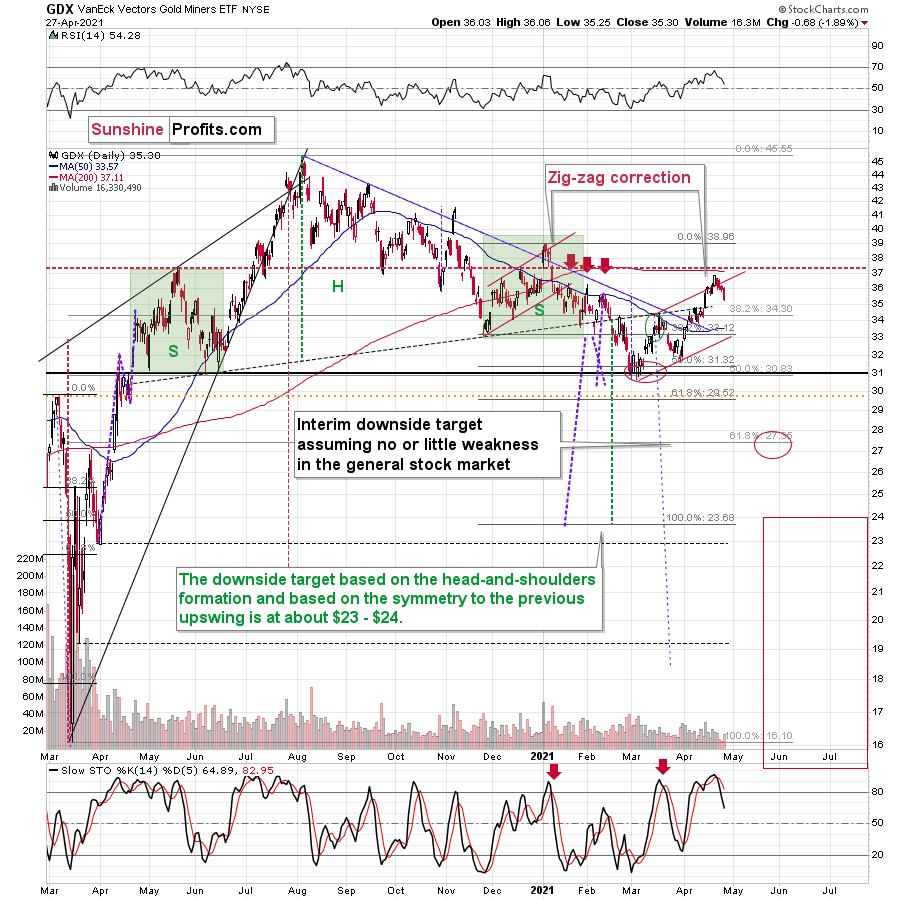
In the previous analyses, I wrote quite a lot about the broadhead and shoulders pattern in the mining stocks. I discussed that in detail on Monday, so I don’t want to cover the same ground once again today, but as a quick reminder, the HUI Index (proxy for gold stocks) – based on this (hypothetical) pattern and the analogy to the previous broad H&S patterns (ones preceding the 2008, 2013 slides) – was likely to form a top close to 300. It topped at 299.09.
Now, the thing that I would like to add today is that we see a possibility of seeing a similar broad head-and-shoulders pattern in gold. I marked gold’s April – June 2020 performance with a blue rectangle, and I copied it to the current situation (the rectangles are identical). As you can see, the current price action and the recent short-term, corrective upswing are near-perfectly aligned.
Of course, back in 2020 the volatility was huge, and investors were very anxious due to the start of the pandemic-based lockdowns and their immediate follow-up. Consequently, it’s no wonder that back then we saw many back-and-forth movements, and this time – when investors calmed down – the correction is simply a zigzag.
We have an analogy in price and time, and a good reason to think that we shouldn’t have analogy in terms of shape. We can also see a breakdown in gold (and a breakout in the USD Index) suggesting that the correction is over.
Therefore, it’s likely that what we’re witnessing now will eventually (once gold moves to new yearly lows) turn out to be a broad head-and-shoulders pattern, with very bearish implications.
Relative Performance Sign
Those who have been following my analyses for some time know that right before bigger declines, the precious metals market tends to behave in a specific way. There’s also a specific way in which it behaves during a bottoming process. Consequently, I’m on a constant lookout for these relative signs in order to better forecast gold’s and silver’s outlook. The good news is that we just saw one, and it perfectly fits the rest of today’s analysis.
Namely, yesterday was the session during which the following happened at the same time:
Gold declined – but only slightly.
Gold stocks declined much more visibly, showing weakness relative to gold.
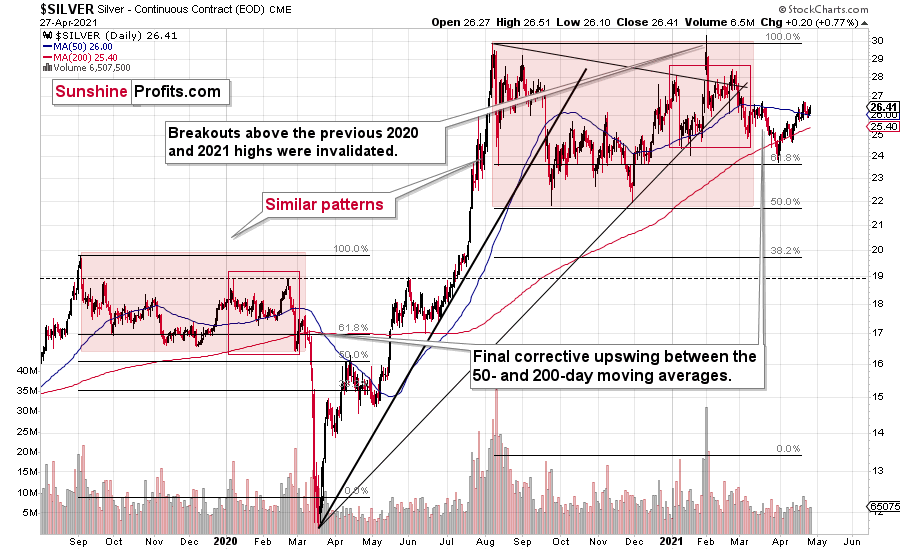
And silver showed strength by rallying somewhat.
This combination of silver’s outperformance of gold and mining stocks’ underperformance of gold is profoundly bearish for the short term. Consequently, it seems very likely to me that the corrective upswing in the precious metals market is already over and the final short-term top was formed last week.
Disclaimer: All essays, research and information found on the Website represent the analyses and opinions of Mr. Radomski and Sunshine Profits' associates only. As such, it may prove wrong ...
more

