
Uptrend In Silver (XAG/USD) Continues To Strengthen
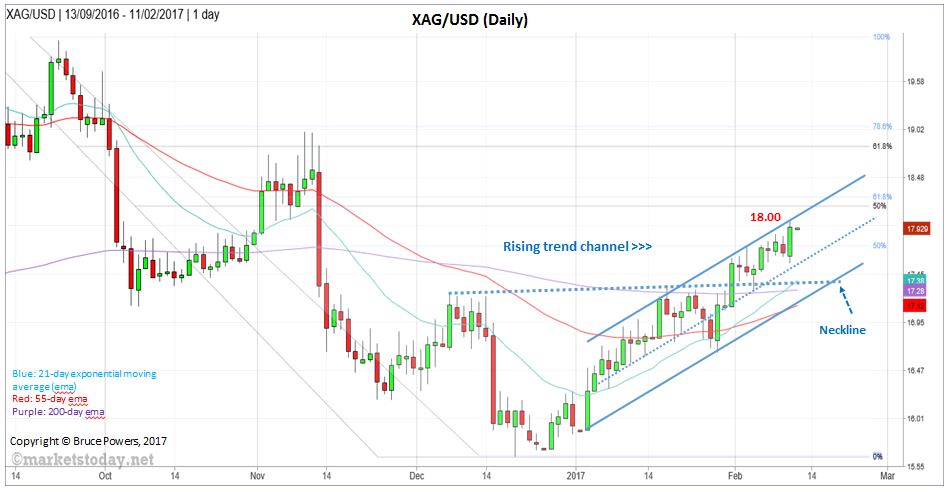
Spot silver (XAG/USD) closed strong last week (17.93), near the high of the week (18.00), as it continues to push up against the top trend line of a relatively well constructed ascending channel. It has been in a rising trend channel for the past seven weeks, ever since hitting a bottom at 15.64 in December. As of last week’s high, silver was up 15.1% off that December low.
Uptrend strengthens
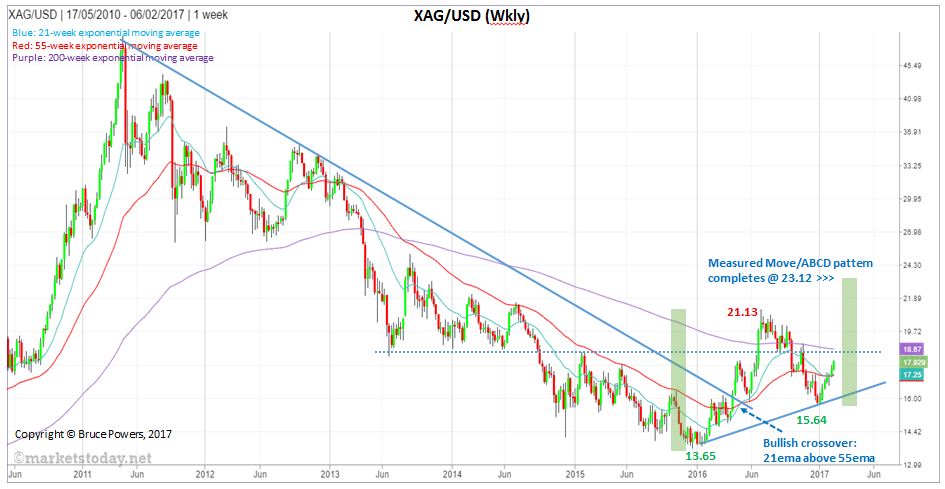
That bottom completed a higher swing low relative to the seven-year low of 13.65 reached in December 2015 (see Weekly chart below). Therefore, it’s another sign that the prior long-term downtrend is turning into an uptrend and that it could keep advancing for some time. Regardless, it does support an argument for a continuation of the seven-week rally.
Multiple bullish signals for seven-week uptrend
Other bullish indications for the seven-week uptrend include the following:
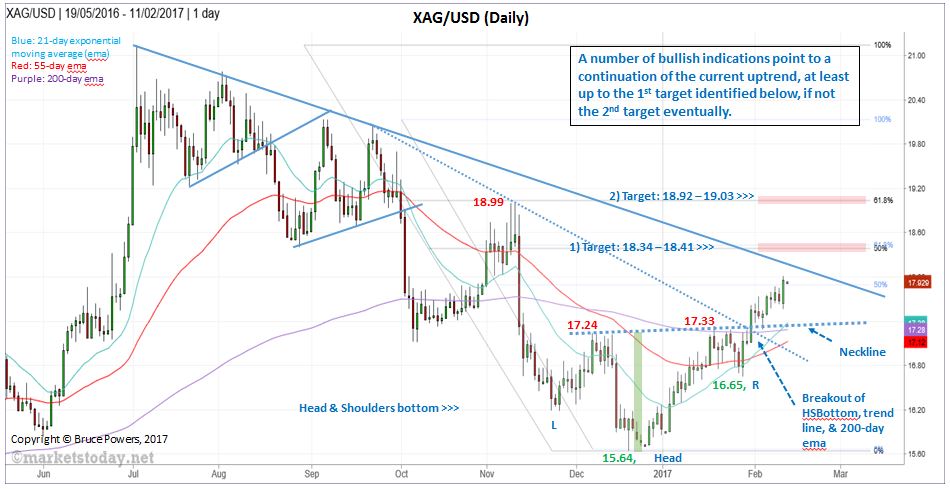
• Breakout of Head & Shoulder Bottom trend reversal pattern two weeks ago
• At the same time breakout of both the 200-day exponential moving average (ema) and internal downtrend line (begun from the December 20.05 peak), thereby further confirming change in trend
• Decisive rally above the December 2016 swing high, which defined the prior downtrend
• Uptrend confirmed with a higher swing high and higher swing low in place
• Breakout above the confluence of the 21-week ema and 55-week ema
• Bullish moving average crossover of the 21-day ema above the 55-day ema
Weakness should find support
Support has been found at the center line of the channel for much of the uptrend and that continues to be the case. Once that line is broken the support should be seen at the lower uptrend line. Of course the price represented by the line will vary depending on when it is reached. More specific price areas to watch for support include the prior swing high resistance of the previous downtrend at 17.24. As silver rallied off the December low it hit resistance around that peak and the advance was stalled for nine-days. Resistance was defined as a range from approximately 17.21 to 17.33. On the way down silver should find support around that price range if not higher. Also within that price range is support of the 200-day ema at 17.28.
Target areas
There are a couple high probability target areas noted on the chart above as these price zones are identified in several ways.
1) First target zone is 18.34 to 18.41, consisting of the completion of a measured move or ABCD pattern (18.34), the 50% retracement of downtrend starting from July 2016 high (18.39), and a 61.8% Fibonacci retracement from the measurement of the internal trend, which starts at the September 2016 peaks (18.41).
2) Second target zone is 18.92 to 19.017, derived from the measuring objective of the Head & Shoulders Bottom (18.92), the November 2016 peak (18.98), the 61.8% Fibonacci retracement of the July 2016 downtrend (19.03), and the 78.6% Fibonacci retracement of the internal downtrend (19.17). (www.marketstoday.net/en/)
Disclaimer: The views and opinions expressed here are solely those of the authors / contributors and do not necessarily reflect the views of more


First target hit last week.(18.34-18.41)