
I hope you had a great weekend!
I spent the last few days with extended family celebrating my brother’s 40th birthday.
We made some great memories and I enjoyed getting a bit of time off the trading desk. But now as we gear up for a new week I’m ready to roll up my sleeves and dive back in!
Now that earnings season is over, investors are facing a handful of interesting crossroads. So this evening, I want to share three charts I’ll be paying close attention to this week.
Will Crude Find Support?
After surging higher this spring, crude oil has settled into a bit of a trading range. Recently, oil futures pulled back to a key support level near $86 per barrel.
(Click on image to enlarge)
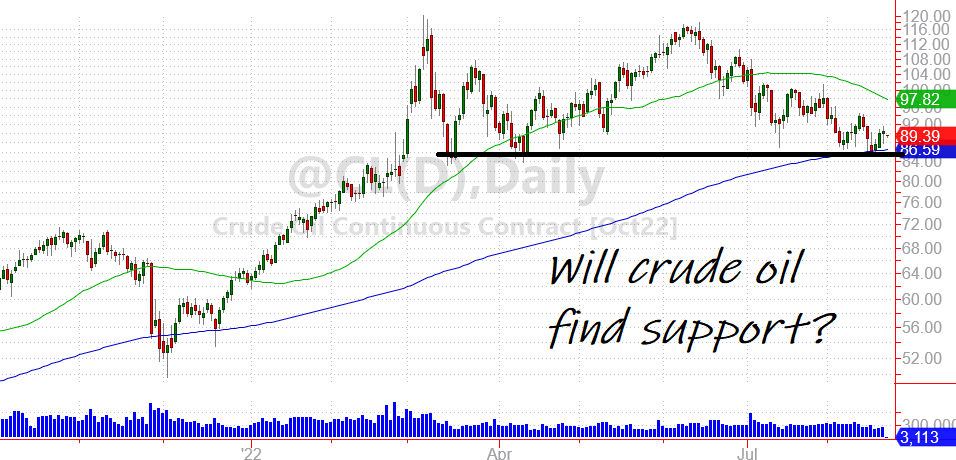
This is the same level where buyers stepped in when oil pulled back in March, April, and briefly in early July.
The long-term price of crude oil is certainly tied to economic growth and the laws of supply and demand. In short term, these support levels can be important indicators.
A significant break below $86 would be cause for alarm.
But if oil can find support in this area and begin trading higher, energy stocks could get a major lift.
If I had to make a call, I’d say oil is likely to trade higher from here. But it will be important to watch how this chart evolves this week.
Gold is Down (But Not Out)
Our second chart for this week tracks the price for an ounce of gold.
(Click on image to enlarge)
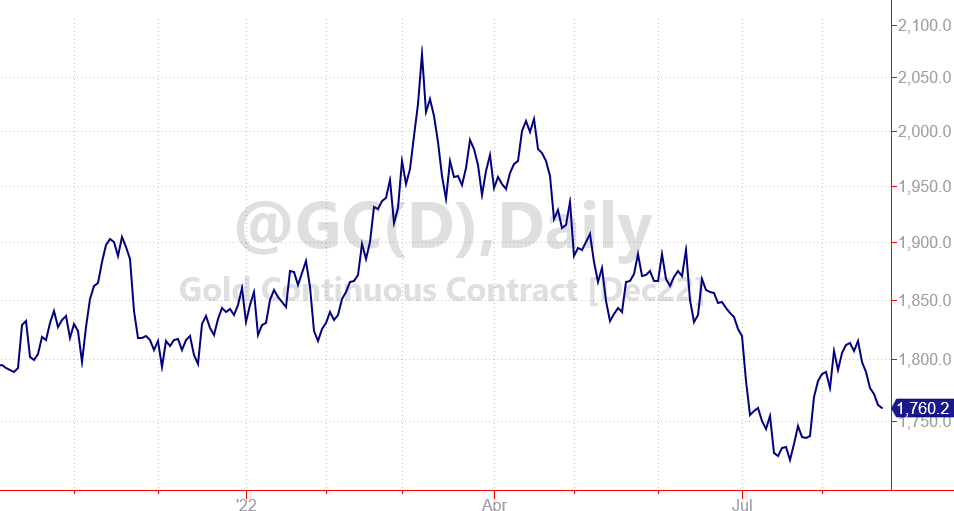
Since its peak in March, gold has been trending lower. Ironically, gold has been pulling back during a time when inflation has been hitting 40+ year highs.
What gives?
Part of the weakness in gold is due to the recent strength of the U.S. dollar. (I wrote a thread about this last week.)
It takes fewer “strong dollars” to buy an ounce of gold. But if the U.S. dollar rolls over, it would provide a tailwind for gold.
If the Federal Reserve decides to be less aggressive with interest rate hikes, it could trigger a major pullback for the U.S. dollar.
We haven’t seen this yet. But a shift in Fed rhetoric could lead to a sharp rally for gold.
What’s Next for Speculative Stocks?
After a brief bear-market rally, speculative tech stocks look weak once more.
Cathie Wood’s ARK Innovation ETF is a great benchmark for these stocks. And while investors got some relief over the last few weeks, they’re still reeling from months and months of selling.
(Click on image to enlarge)
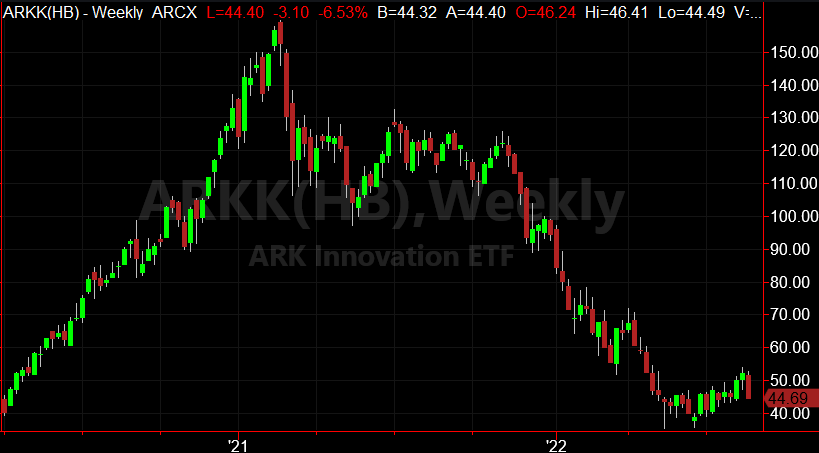
Last week’s rollover for ARKK is a stern warning for growth stock investors.
There’s still a tremendous amount of risk for speculative investors. Stocks are still headed lower.
Avoid stocks of companies that don’t currently turn a profit. And also beware of stocks that trade at high multiples compared to small earnings per share.
If investors continue to move capital out of growth stocks and into value plays, ARKK could have much further to fall. Even if you’re not invested in ARKK, make sure you avoid speculative tech stocks for now.
It’s going to be an interesting week on Wall Street. So make sure you stay in touch (and keep a close eye on these three charts).
Here’s to building and protecting your wealth!
More By This Author:
Here’s What The Biggest Investors Are BuyingConsumers are Spending on Fun – Invest With Them
Lower Mortgage Rates Could Trigger A New Surge For Stocks


Comments
Log in or sign up to join the conversation.