The World’s Fragile Economic Condition
Where is the world economy heading? In my opinion, a large portion of the story that we usually hear about how the world economy operates and the role energy plays is not really correct. In this post (to be continued in Part 2 in the near future), I explain how some of the major elements of the world economy seem to function. I also point out some relationships that tend to make the world’s economic condition more fragile.
Trying to explain the situation a bit further, the economy is a networked system. It doesn’t behave the way nearly everyone expects it to behave. Many people believe that any energy problem will be signaled by high prices. A look at history shows that this is not really the case: fighting and conflict are also likely outcomes. In fact, rising tariffs are a sign of energy problems.
The underlying energy problem represents a conflict between supply and demand, but not in the way most people expect. The world needs rising demand to support the rising cost of energy products, but this rising demand is, in fact, very difficult to produce. The way that this rising demand is normally produced is by adding increasing amounts of debt, at ever-lower interest rates. At some point, the debt bubble created to provide the necessary demand becomes overstretched. Now, we seem to be reaching a situation where the debt bubble may pop, at least in some parts of the world. This is a very concerning situation.
Context. The presentation discussed in this post was given to the Casualty Actuaries of the Southeast. (I am a casualty actuary myself, living in the Southeast.) The attendees tended to be quite young, and they tended not to be very aware of energy issues. I was trying to “bring them up to speed.” This is a link to the presentation: The World’s Fragile Economic Condition.

Slide 1
Slide 2
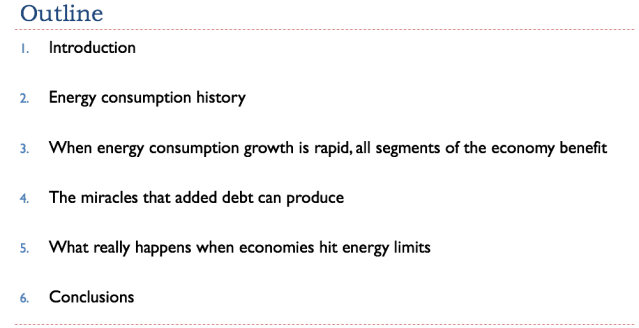
This post covers only Items 1, 2, and 3 from the Outline in Slide 2. I will save Items 3 through 6 for a post called “The World’s Fragile Economic Condition-Part 2.”

Slide 3

Slide 4
The audience was able to guess that the situation for humans and the economy are parallel. Energy in some sense powers the economy, in a way similar to how food powers humans.

Slide 5
On Slide 5, I am pointing out that changes in the red line, denoting energy consumption growth, tend to come before the corresponding changes in the blue line. This is one way of confirming that energy consumption causes GDP growth, rather than vice versa.
In recent years, countries have found ways of creating GDP growth, without adding true value. This may explain why GDP growth is higher than Energy growth since 2013 on Slide 5. As an example of GDP growth with overstated value, a large share of young people are now being encouraged to purchase advanced education, at considerable cost. This would make sense if there were suitable high-paying jobs for all of those graduating. It is questionable whether this is the case.
Slide 6
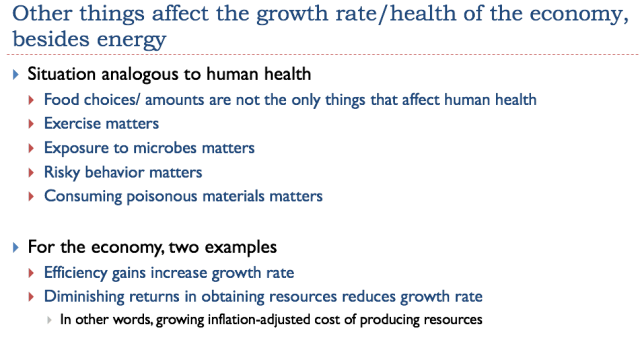
Of course, the issue is not only energy consumption, just as our health is influenced by more than simply what food we eat.
Slide 7
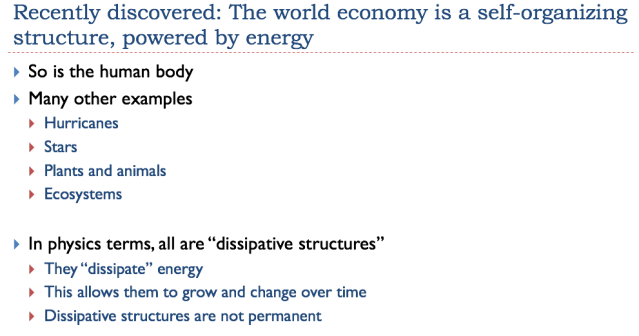
At one time, the emphasis in physics was on systems that are “closed” from an energy point of view. Such systems never grow; they simply decline toward “heat death.”
The real world is made up of many structures that grow and change over time. This growth and ability to change is possible because the energy system we live in is thermodynamically “open,” thanks to flows of energy from the sun, and thanks to fossil fuel energy, which represents stored solar energy from long ago.

Slide 8
The answers to the questions on Slide 8 are easy to guess.

Slide 9
The economy adds new businesses, as citizens see new needs and set up companies to meet those needs. Customers make choices regarding which goods and services to buy, based on their income (primarily wages) and the prices of available goods and services. Governments gradually add new laws, including changes to the way taxes, are assessed. The system gradually grows and changes, as the population grows, and as the quantity of goods and services created to meet the needs of that population increases.
One thing to note is that the goods and services produced by the system will eventually be divided among the various players in the system. If one group gets more (say, those receiving interest income), then other groups will necessarily receive less.
Another important point to note is that as new products are added, old ones disappear. For example, once cars came into use, we lost the ability to go back to horses and buggies. There are no longer enough horses; there are no longer facilities to “park” the horses in downtown areas, while at work or shopping; and there are no longer services to clean up after the mess that the horses make.
Without being able to go backward, the system is quite brittle. It would appear that under sufficiently adverse conditions, the entire system could collapse. In fact, we know that many ancient civilizations did collapse when conditions weren’t right.

Slide 10
The strange interconnections of a networked system make the world economy behave in a different way than we might initially expect. Later in this presentation (in Part 2 of the write-up), I will show some examples of inadequate energy supplies leading to very different results than high prices.
Slide 11
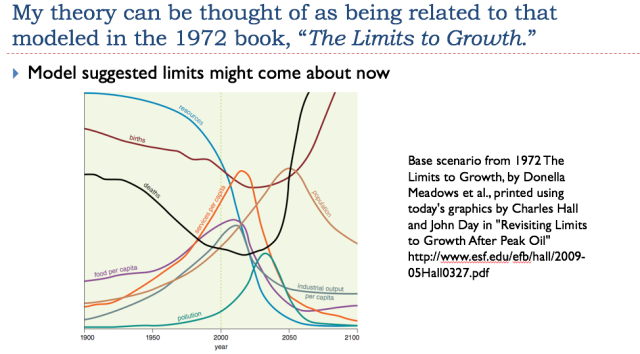
The Limits to Growth model looked at how long resources might last before the growth of the world economy came to a halt from a variety of problems, including a lack of easy-to-extract resources. In some ways, the model was quite simple. For example, the model did not include a financial system or debt. In the single most likely scenario, the base run, the world economy hit limits about now, in the 2015 to 2025 time period. The authors have said that, once limits are hit, the forecast on the right-hand side of the chart cannot be relied upon; the model is too simple to forecast how the downslope might actually occur.

Slide 12
Slide 13
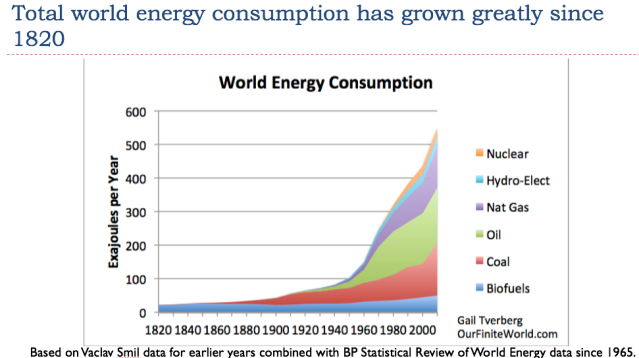
The pattern of world energy consumption seems to be one of rapid growth, especially in the period since World War II.
Slide 14
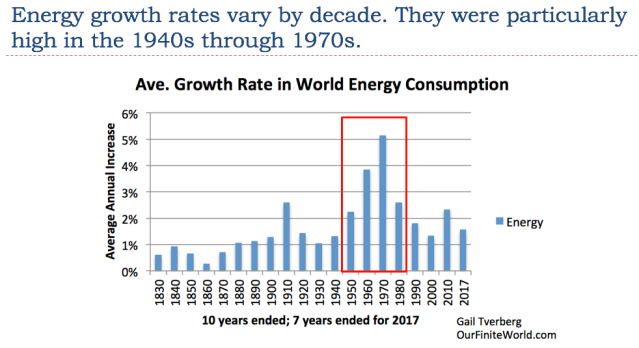
Energy consumption growth is particularly high in the period covered by the red box. In other words, energy consumption growth is particularly high from the 1940s through the 1970s. If the economy relies on energy, we would expect this to be a particularly booming period for the economy.

Slide 15
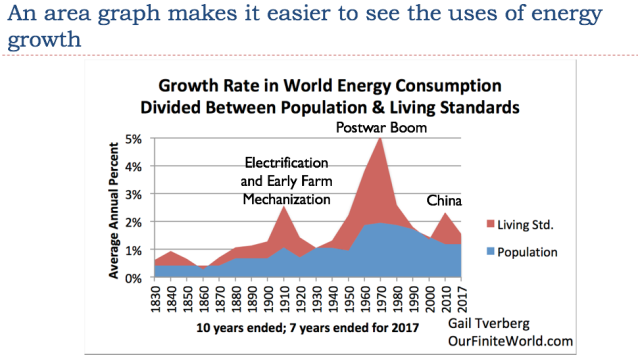
We can break energy consumption growth down into two components: (1) the portion to cover higher population, and (2) the portion to cover improved standards of living. Looking at this chart, it is clear that “higher population” takes the majority of the increase, except when increases are very large.
Slide 16
I have labeled the three big bumps with my view of what seems to have led to them. The first is early electrification, when street cars were added and when the early mechanization of farming was implemented. The second is the postwar boom and the third is the recent period of globalization, led by China’s major ramp up in coal production.

Slide 17
China’s energy consumption grew rapidly after it joined the World Trade Organization in 2001. The thing that most people don’t realize is that China is reaching limits on its coal extraction. Its coal production seems to have peaked about 2013. Its comparatively tiny amount of wind and solar (shown in orange on the chart) is not making up the shortfall. Instead, China is being forced to rely more on imported energy. Imported energy tends to be higher in cost, and may be limited in supply. For all these reasons, we cannot rely on China to continue to power future world economic growth.

Slide 18
It is not just China that gets only a small share of its energy production from wind and solar. This is also true of the world as a whole.

Slide 19

Slide 20
Boxes 1 through 4 show a different model of how the world economy works than that shown earlier (in Slide 9). In Slide 20, the Economy (in Box 3) acts like a giant factory. It uses Resources of various kinds (a few of which are listed in Box 2) to make Goods and Services (a few of which are listed in Box 4). If the Economy is getting to be more and more efficient, Box 4 will expand much more rapidly than Box 2, producing a great abundance of goods and services. If this happens, all of the Resource Providers in Box 1 (plus some I have failed to list) can be rewarded more than adequately for their services, with Goods and Services produced by the economy. The transfer of these Goods and Services occurs through the use of money.

Slide 21
Everyone can get rich at once!
Slide 22
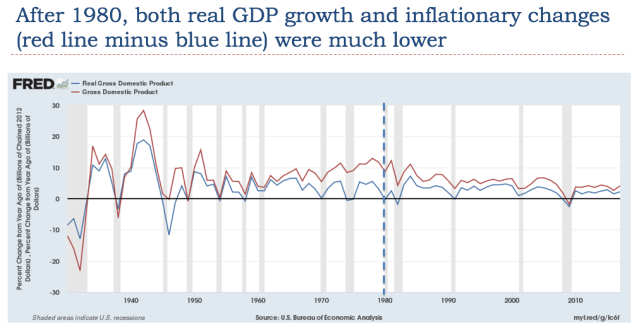
The top line is GDP growth including inflation; the bottom line is GDP growth excluding inflation. Before the dotted line, both GDP growth rates and inflation rates are high; after the dotted line, (when energy growth was lower), they tend to be lower.

Slide 23
Interest rates were raised to try to damp down oil and other energy prices. We will see in a later section that reducing interest rates helped hide the fact that energy growth was slower after 1980.
Slide 24
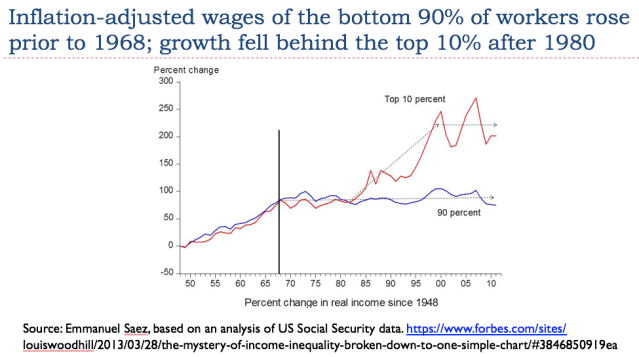
The wages shown on Slide 24 have already been inflation adjusted. Thus, in the period before 1968, wages for both the lower 90% of workers and for the top 10% of workers were rising rapidly, even considering the impact of inflation. Many families were able to afford a car for the first time. After 1980, the wages of the top 10% rose much more quickly than the wages of the bottom 90%.
Slide 25
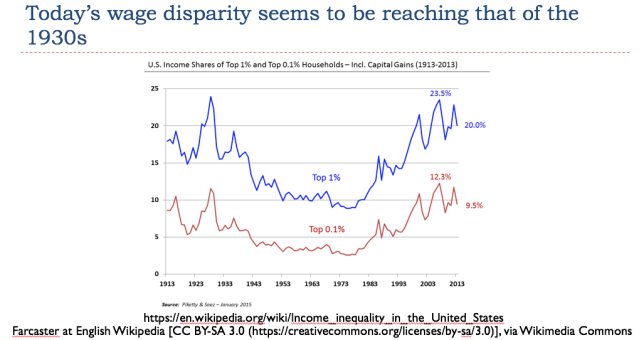
In 1930, wage disparity seems to have been at about today’s level. Early mechanization had replaced many jobs, both on the farm and elsewhere. Farmers who could not afford the new technology found that they could not produce food cheaply enough to compete with the low prices made possible by the new technology. The growing wage disparity meant that a large share of the population could not afford more than the basic necessities of life. The many people with low wages kept demand for most goods and services low. Oil prices were low, and there was a glut of oil, not unlike what recent markets have experienced. New tariffs were added, and immigration was restricted.

Slide 26
The period before the mid-1970s is when a great deal of the United States’ infrastructure was built. The Eisenhower Interstate Highway System dates from this time period. Many of the oil and gas pipelines and electricity transmission systems in use today were also built in this period.
Once the price of oil and other energy products started rising, it became much more expensive to add or replace this type of infrastructure. Once oil prices rose, more debt at lower interest rates seemed to be needed to keep the economy growing, as I will explain in Part 2 of this write-up.

Slide 27
The least expensive to extract oil supply–US oil supply in the contiguous 48 states that could be extracted by conventional means–was developed first. Alaska production was added when it was clear that the early supply was starting to deplete. It was more expensive, as was North Sea oil, which was also added after early US oil began to deplete.
Once oil prices rose in the 2005-2008 period, companies became interested in developing oil from shale formations (sometimes called tight oil). This oil seems to be much more expensive. It is doubtful that this oil is profitable at today’s prices.

Slide 28
Many people believe that oil prices will rise, indefinitely, with the cost of production. The thing that they don’t realize is that high oil prices tend to lead to recession. When this happens, employment drops and the average buying power of the population no longer rises–it tends to remain flat or falls. As a result, high oil prices do not “stick.”

Slide 29
We are today in a situation where oil prices have been too low for years. For a while, this situation can be hidden, but eventually, low investment can be expected to lead to lower production of energy products. It is even possible that some governments of oil exporters may collapse from lack of adequate tax revenue. Governments of oil exporters often obtain over half of their total tax revenue from taxes on oil production. Adequate tax revenue for these governments requires a high selling price for oil.
The situation with food prices tends to parallel oil prices. This occurs partly because oil is used in growing and transporting food, and partly because of substitution issues. For example, corn can be used to make either ethanol for vehicles or food for people.
Slide 30
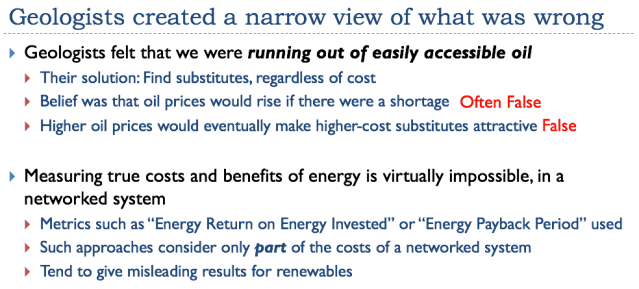
M. King Hubbert was one of the early scientists who talked about what appeared to be a problem of running out of oil and other fossil fuels. While I call him a geologist, he really was a geophysicist. The catch was that the physics thinking of the day was mostly about “thermodynamically closed systems.” If closed systems were the problem, then running out of fossil fuels that could be extracted using current techniques was the major issue.
Hubbert and others did not realize that energy supply is part of a larger economic system, which also functions under the laws of physics. The economic system is part of a thermodynamically open system, not a closed system. It gets energy both directly from the sun and from fossil fuels, which provide solar energy stored as fossil fuels.
The issue is how this larger economic system behaves: does it allow the oil prices to rise to a high enough level to extract all of the oil and other fossil fuels that seem to be available? I don’t think it does. But under the “right” conditions (lots of debt growth), the economic system does allow energy prices to rise somewhat. This is what we have seen since the 1970s.
It is extremely difficult to figure out what true costs and true benefits are in a networked system. The standard approach for evaluating the benefit of wind and solar considers only a small part of the system. If the proposed devices do not directly burn fossil fuels and if not too much fossil fuel is used in their production, the usual practice is to assume that the devices must be helpful to the overall system, because they seem to be “low carbon.” This approach leaves out many important costs.
The problem is that wind and solar are not now, and never can be standalone devices. When all costs are considered, they are simply very inefficient add-ons to the fossil fuel system. These costs include buffering services (using batteries or other storage), the cost of capital, the cost of leases, and wages and taxes. A very high-cost electricity generating system is not likely to be helpful to the economy because such a system is very inefficient. It can be expected to affect the economy as adversely as high-priced oil does.
Slide 31
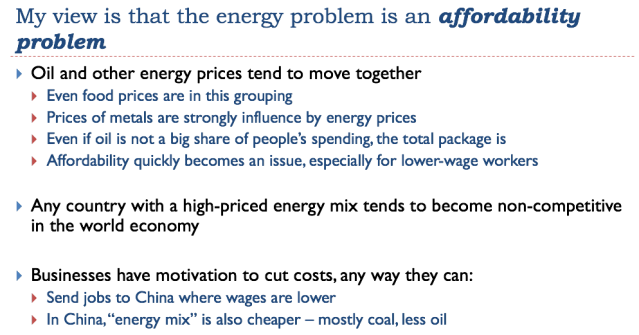
An economy operates best when energy costs are very low because goods and services made with this low-cost energy tend to be low-cost as well. Oil is used in producing and transporting food. Thus, low-cost oil tends to produce inexpensive food.
If energy costs begin to rise in a country, it tends to make that country less competitive in the world marketplace. It also tends to push the country toward recession, because the higher costs are difficult to recover from customers whose wages don’t rise to cover the higher costs.

Slide 32
Many people believe that the amount of fossil fuel that will ultimately be extracted depends on a combination of (a) the amount of resources in the ground, and (b) the technology developed for extraction. While these are indeed eventual limits, I think that a maximum affordable price limit comes much sooner. This depends on how high a debt bubble the economy can sustain. The role of debt will be discussed in Part 2.

Slide 33
One thing that is confusing is the familiar supply and demand curve for energy. Many people believe that “of course” prices must rise if energy is scarce. The catch is that energy consumption affects all parts of the economy. It takes energy to create jobs, just as it takes energy to produce goods and services. Because both supply and demand are affected by a shortage of energy, our intuition regarding how prices should move can be totally wrong.
The word “Demand” is confusing, also, because most energy use is difficult to see. Most energy use is not found in the gasoline we buy at the pump or the electricity we purchase. Instead, energy is used in creating the streets that we drive on, and in building the schools that our children attend. Building new homes and manufacturing cars also takes huge amounts of energy. If energy costs rise very much, the problem is that many people can no longer afford homes or cars. Instead, young people live in their parents’ basements indefinitely. Governments may decide to stop paving some roads because repaving is too expensive to afford. Reduced demand for oil might be better described as reduced purchases of goods and services of all kinds because certain groups of would-be buyers find prices too high to afford.
Disclosure: None.


"Energy Limit" is what folks can afford to pay for energy. It has very little to do with availability. Previous energy shortages were exclusively the result of a concerted effort to boost energy prices, and those efforts were indeed very successful. But the higher prices did not really benefit the 90% of the population at all. The economy expended in spite of the increase, not because of it.
And the unfortunate thing about debt is that it must be repaid, it is not a sustainable resource, as claimed.
Good points.