
In today’s globalized economy and interconnected financial markets, no market can truly move on its own. The context matters a lot, and two of the most important “external” markets from the point of view of precious metals investors and traders are the stock market and the currency market. In the case of the latter, it’s the USD Index that provides the greatest insights. Consequently, in today’s analysis, I’ll cover those two areas. Let’s start with stocks.
Declining stock prices would only add fuel to the bearish fire (after all, gold stocks are… just stocks) and that’s exactly what’s likely to happen.
(Click on image to enlarge)
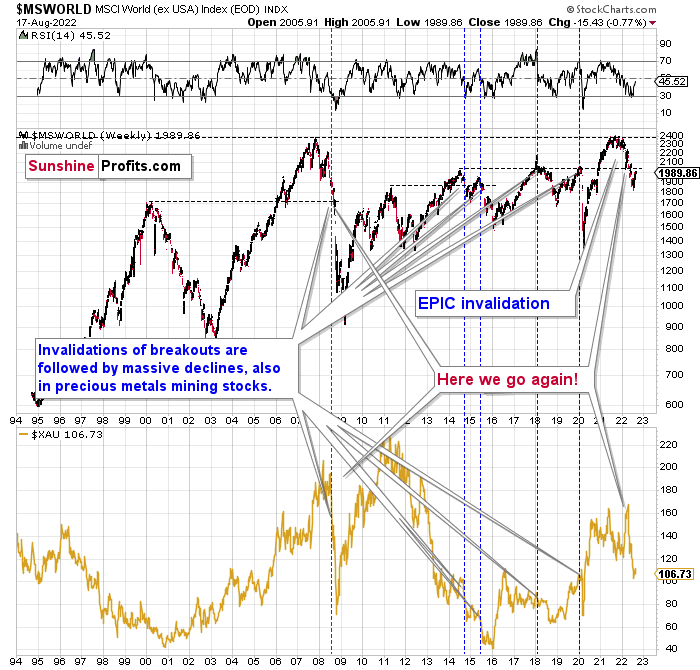
The technical picture in the case of world stocks remains extremely bearish, and my previous comments on it were just confirmed. Here’s what I’ve been writing about the above chart for quite a few weeks now:
World stocks have already begun their decline, and based on the analogy to the previous invalidations, the decline is not likely to be small. In fact, it’s likely to be huge.
For context, I explained the ominous implications on Nov. 30. I wrote:
Something truly epic is happening in this chart. Namely, world stocks tried to soar above their 2007 high, they managed to do so, and… failed to hold the ground. Despite a few attempts, the breakout was invalidated. Given that there were a few attempts and that the previous high was the all-time high (so it doesn’t get more important than that), the invalidation is a truly critical development.
It's a strong sell signal for the medium - and quite possibly for the long term.
From our – precious metals investors’ and traders’ – point of view, this is also of critical importance. All previous important invalidations of breakouts in world stocks were followed by massive declines in mining stocks (represented by the XAU Index).
Two of the four similar cases are the 2008 and 2020 declines. In all cases, the declines were huge, and the only reason why they appear “moderate” in the lower part of the above chart is that it has a “linear” and not a “logarithmic” scale. You probably still remember how significant and painful (if you were long, that is) the decline at the beginning of 2020 was.
All those invalidations triggered big declines in the mining stocks, and we have “the mother of all stock market invalidations” at the moment, so the implications are not only bearish, but extremely bearish.
World stocks have declined below their recent highs, and when something similar happened in 2008, it meant that both stocks and gold and silver mining stocks (lower part of the chart) were about to slide much further.
The medium-term implications for mining stocks are extremely bearish.
However, let’s get back to the short- and medium-term points of view.
(Click on image to enlarge)
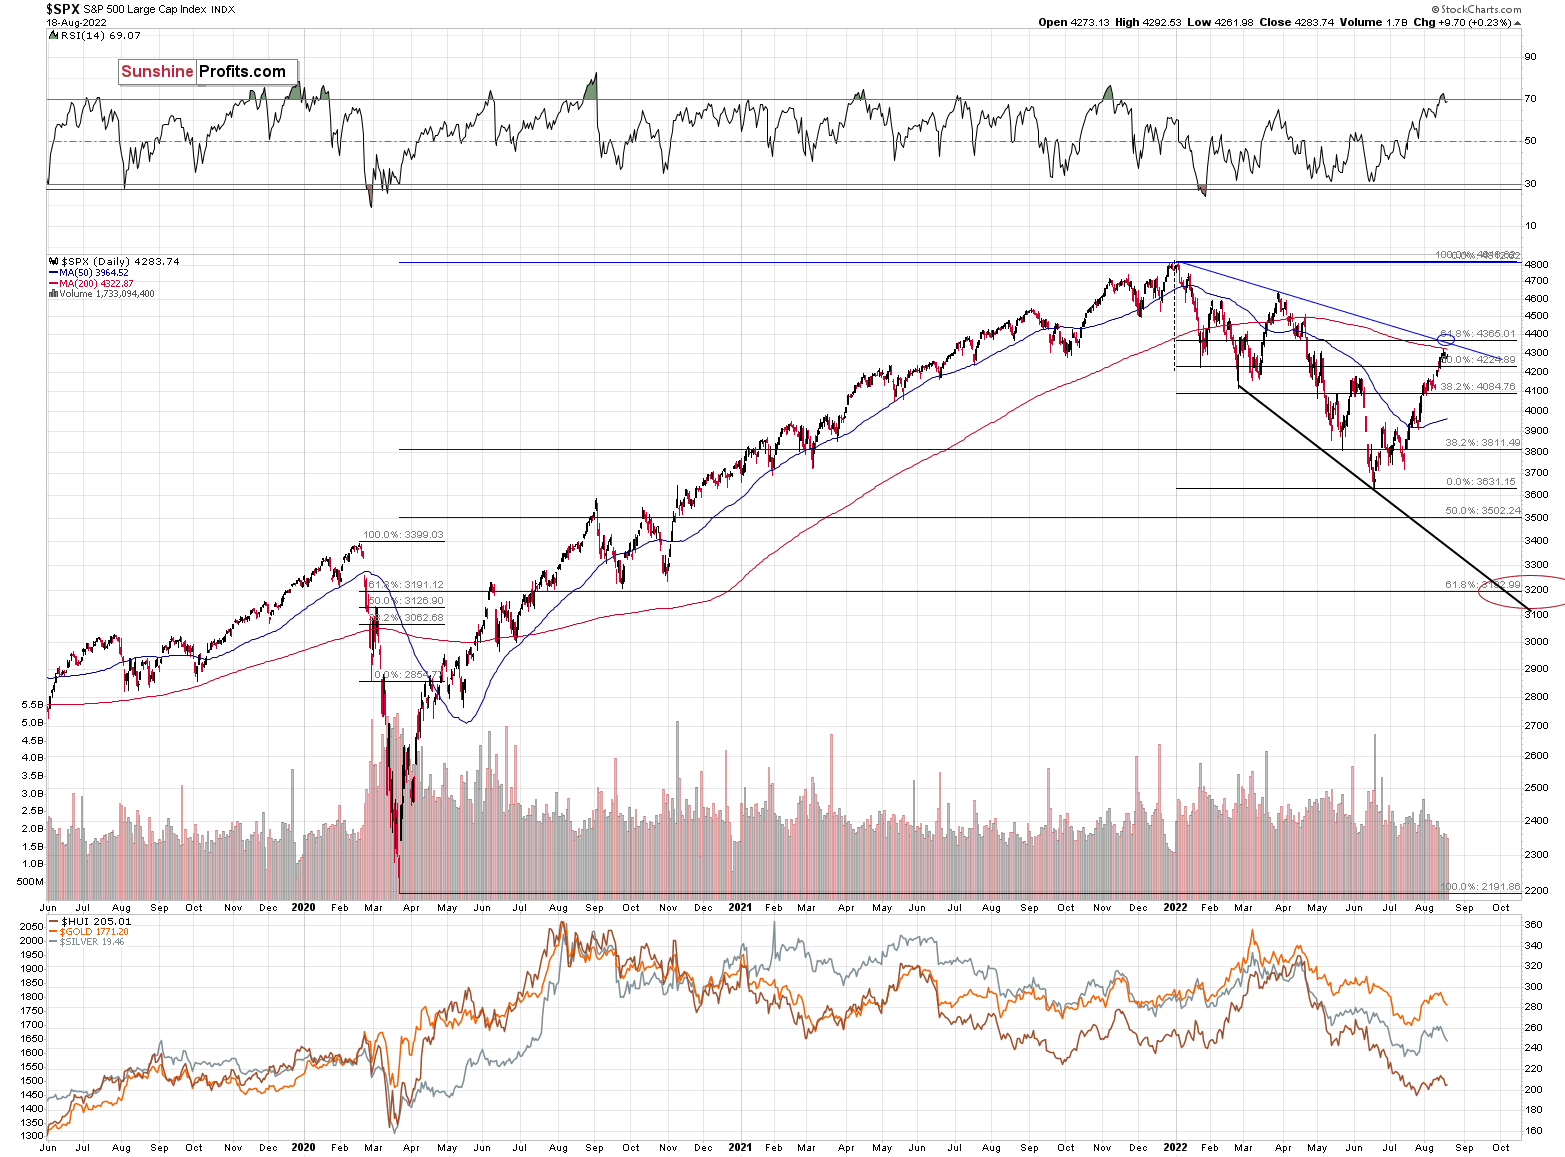
Stocks rallied recently, but since they corrected approximately to their previous June highs and March lows, the rally might be over, or very close to being over.
Especially since the RSI had just moved above 70, and then declined back below this level. This indicated local tops many times in the past.
As I had indicated previously, interest rates are likely going up, which is a bearish factor for the stock market, and the recent rally was likely due to the market’s misinterpretation of the importance of Powell’s speech. The S&P 500 wanted to correct (based on emotional = technical reasons) and it used Powell’s seemingly dovish comments as an excuse to do so. However, what materially changed? Nothing. Interest rates are likely to be raised, as inflation remains the key political issue right now, and the markets are likely to respond by declining.
Most interestingly, though, such a decline would likely have a devastating effect on the prices of mining stocks (especially junior mining stocks) and silver. There might be some impact on gold, too.
The above would also be in tune with an extra rally in the USD Index. After all, less competitive exports are not that favorable for the U.S. economy.
(Click on image to enlarge)
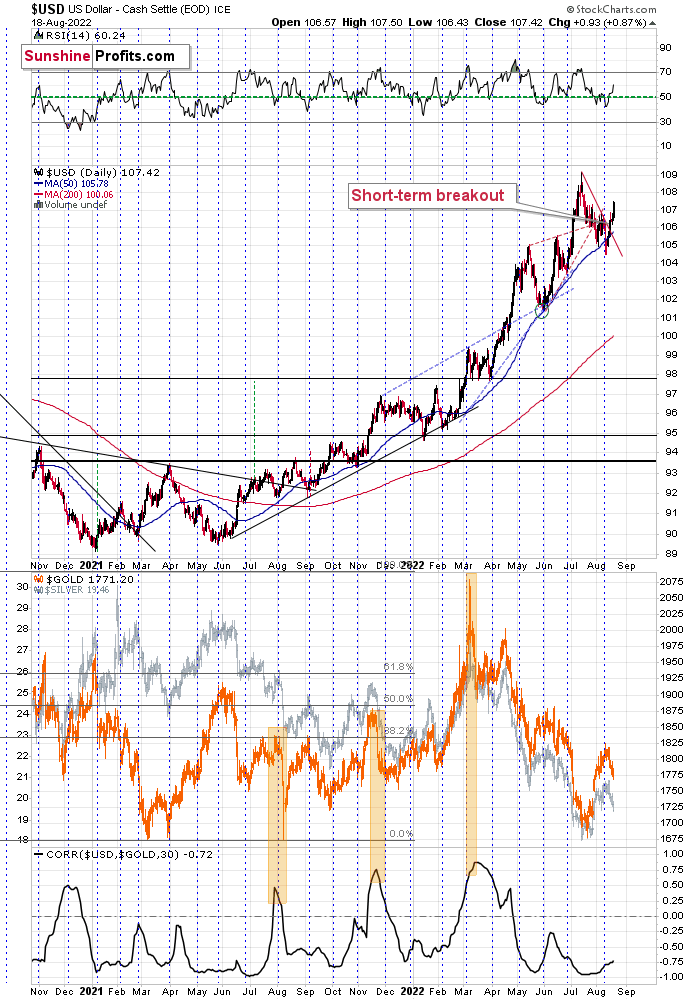
The USD Index had recently moved slightly below its 50-day moving average, and then it moved back above it.
After that, it started to rally, and it has continued to rally until this moment.
This move is in tune with what we saw at previous local bottoms. The RSI moved slightly below 50, which used to accompany bottoms in the previous months.
So, the scenario in which the USD Index has already bottomed seems quite likely.
(Click on image to enlarge)
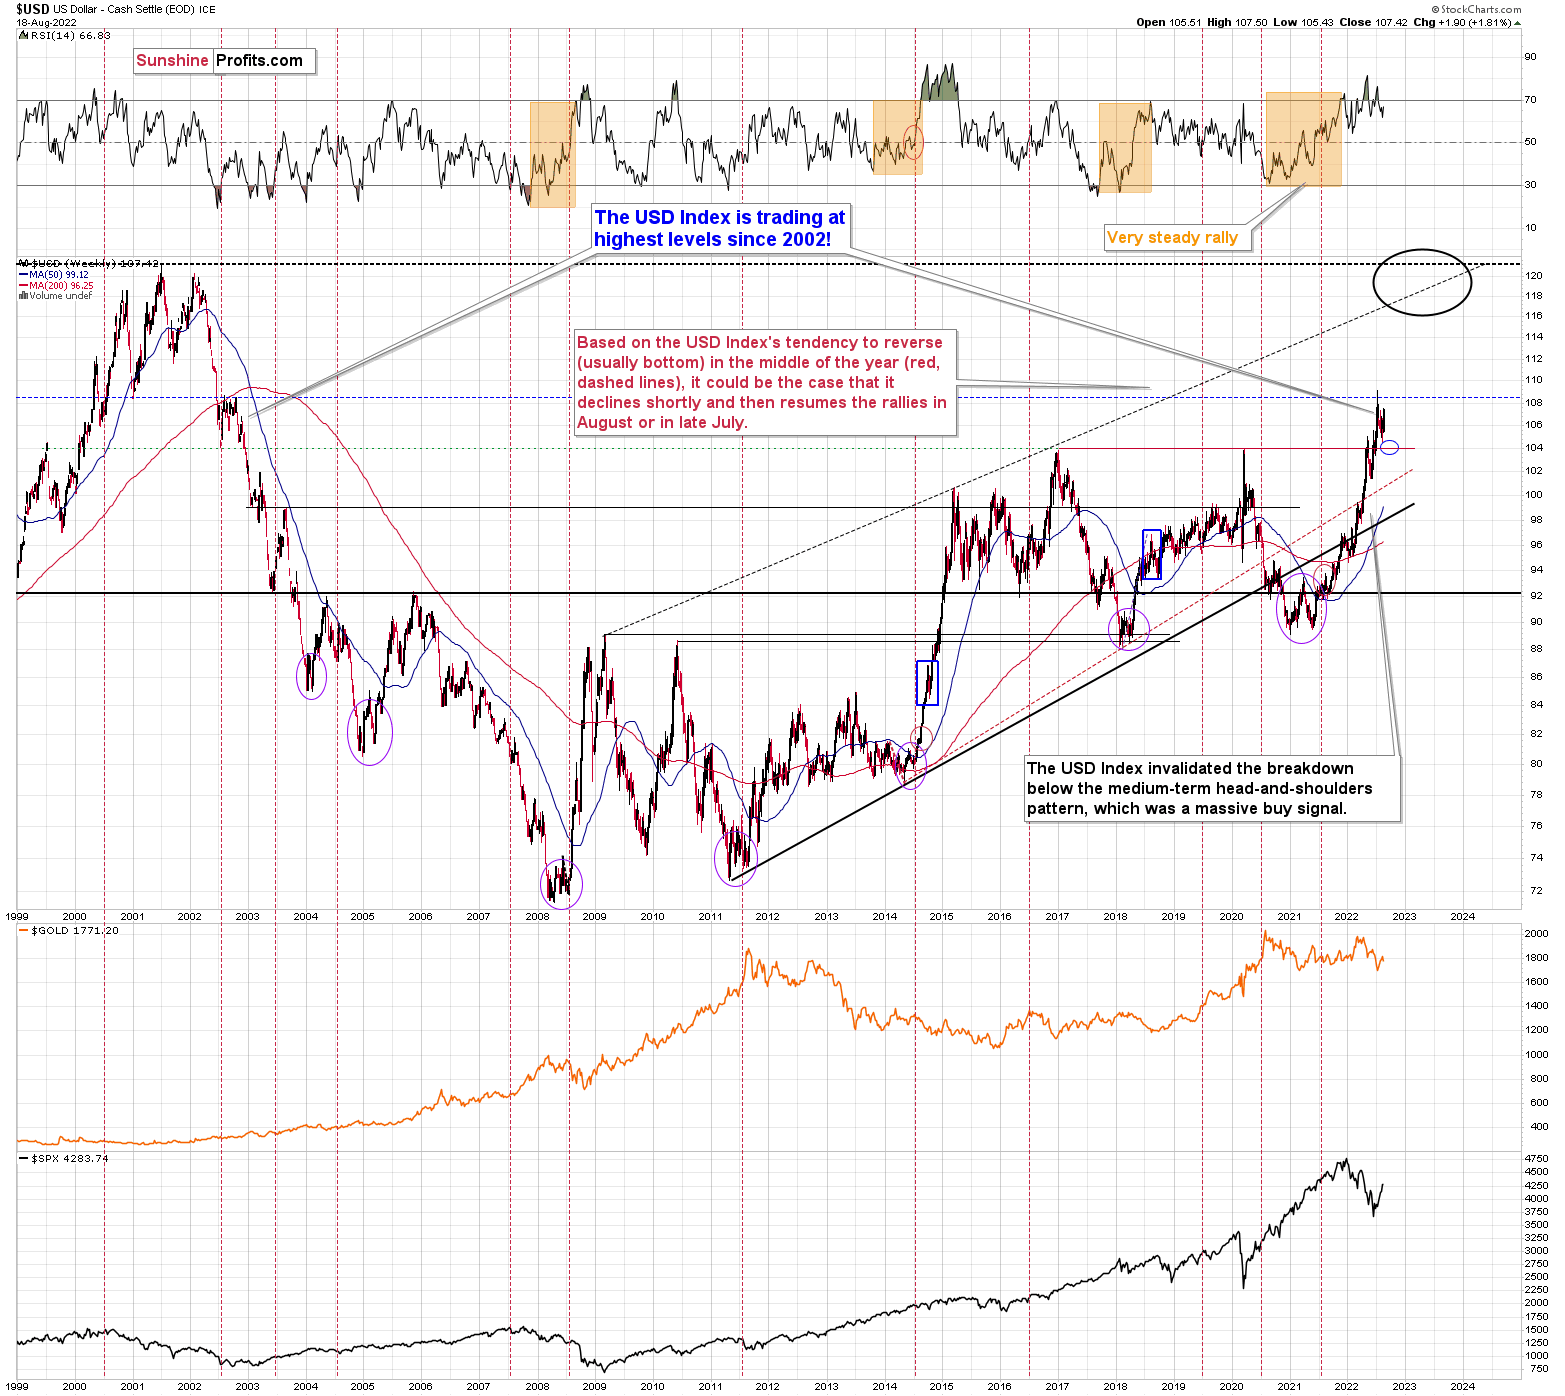
I previously wrote the following about the USD Index’s long-term chart:
There’s also the possibility that the USD Index keeps declining until it reaches the very strong support at about the 104 level – the previous long-term highs (…).
Last week, the USD Index bottomed at about 104.5, which was very close to the above-mentioned 104 level. If traders had expected the USD Index to bottom at this level, then some of them might have bought at higher levels in order to maximize their odds of catching the bottom, thus actually creating the bottom at higher levels.
Since the USD Index is already (at the moment of writing these words) back above the 107.5 level, it could be the case that the short-term bottom is already in. Actually, there were only five sessions this year when the USD Index closed at levels that were higher than the current USDX value.
This, in turn, likely means that the peak for precious metals is already in.
More By This Author:
Why Is The USDX Weak Lately And Gold Not Responding To It?The GDXJ Didn’t Benefit From Investors’ Bullish Frenzy
Is There Any Chance Of An Interest Rate Cut In 2023?


Comments
Log in or sign up to join the conversation.