
The USD Had A Slip-Up, But Gold Turned A Blind Eye To It
“It’s my party and I’ll fall if I want to”, sang gold and kept its word. Although the dollar weakened, gold seemed reluctant to take advantage of it.
Now that was a big decline in the USD Index! What made gold yawn and why is it declining today? Because it doesn’t want to rally.
I’ve been writing this over and over again, and yet I’ll write it once more. Markets don’t move in a straight line up or down, and periodic corrections are natural. However, the way markets interact during those corrections tells us a lot about what’s likely to take place next, at least in the case of some markets.
The USD Index declined quite visibly yesterday and in today’s overnight trading.
(Click on image to enlarge)
The key questions are: so what, and if that was completely unexpected.
Starting with the latter, it wasn’t unexpected. It’s something in tune with gold’s long-term chart.
(Click on image to enlarge)
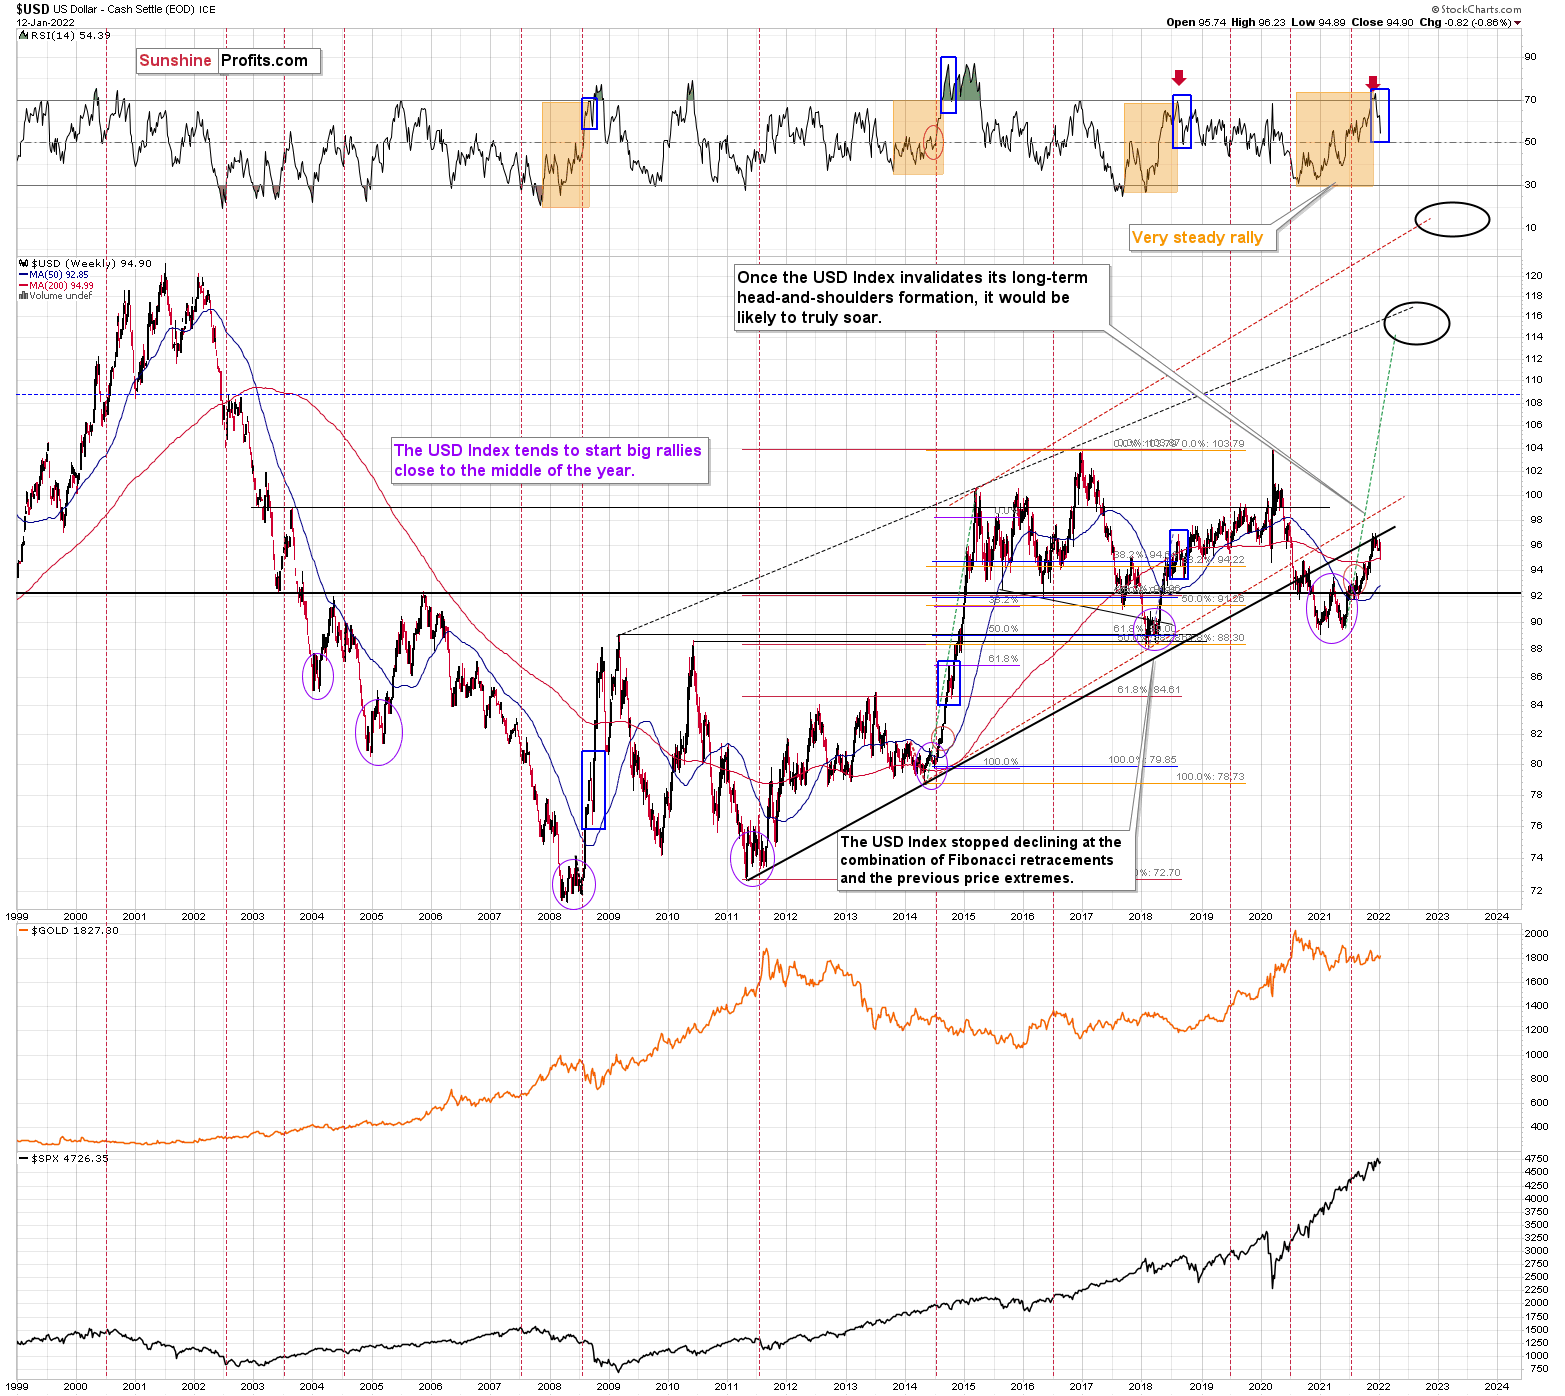
When the weekly RSI (based on the weekly price changes) for the USD Index hit 70, I wrote the following:
Also, please note that the recent medium-term rally has been calmer than any major upswing witnessed over the last 20 years, where the USD Index’s RSI has hit 70. I marked the recent rally in the RSI with an orange rectangle, and I did the same with the second-least and third-least volatile of the medium-term upswings.
The sharp rallies in 2008 and 2014 were of much larger magnitudes. And in those historical analogies, the USD Index continued its surge for some time without suffering any material corrections.
As a result, the short-term outlook is more of a coin flip.
Consequently, the current decline is not unexpected, it’s rather normal.
I marked additional situations on the above chart with orange rectangles – these were the recent cases when the RSI based on the USD Index moved from very low levels to or above 70. In all three previous cases, there was some corrective downswing after the initial part of the decline, but once it was over – and the RSI declined somewhat – the big rally returned and the USD Index moved to new highs.
I marked those declines in the RSI with blue rectangles, and I did the same thing for the current decline. As you can see, the size of the move lower is currently analogous to previous short-term corrections that were then followed by higher prices. This means that it’s quite likely over or very close to being over, and the medium-term rally can return any day now.
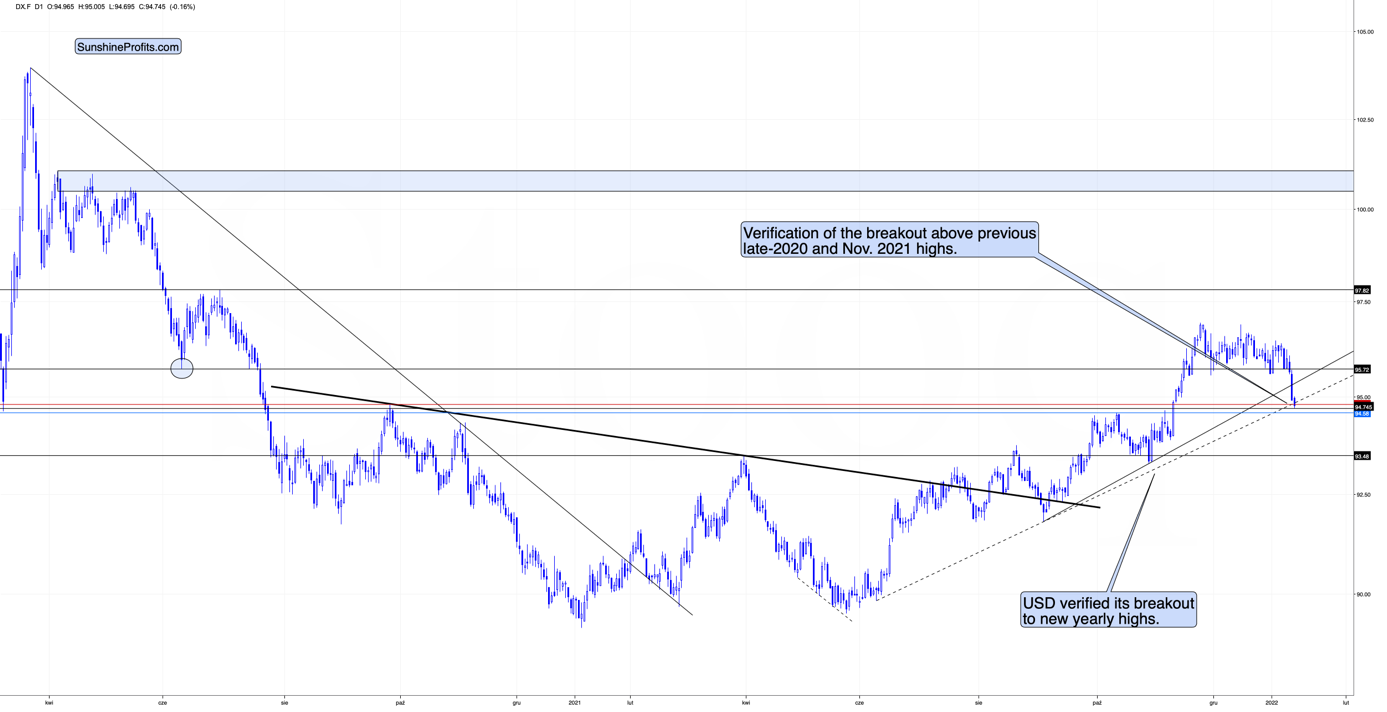
Moving back to USD’s short-term chart, we see that the USD Index just (in overnight trading, so the move is not even close to being confirmed) moved a little below USDX’s rising support line based on the previous June and October 2021 lows. At the same time, the USDX is slightly below its late-2020 top and slightly above its November 2021 top.
In light of the situation on the long-term USDX chart (as discussed above), this combination of support levels is likely to trigger a rebound and the continuation of the medium-term rally.
At the beginning of 2021, I wrote that the year was likely to be bullish for the USD Index, and my forecast for gold (and the rest of the precious metals sector) was bullish – against that of almost every one of my colleagues.
The USD Index ended 2021 about 6% higher, gold was down about 3.5%, silver was down almost 12%, the GDX ETF was down by about 9.5%, and the GDXJ ETF (proxy for junior mining stocks, my primary tool for shorting the precious metals sector in 2021 – I wasn’t shorting gold at any point in 2021) was down by about 21%.
What about this year? It’s a tough call to say how the entire year will go, but it seems to me that the USD Index will move higher, and we’ll see both in the PMs: a massive decline, and then a huge rally. It’s very likely to be a year to remember for anyone interested in trading gold, silver, and/or mining stocks and/or investing in them.
Let’s get back to the current situation.
The USD Index declined to fresh 2022 lows – well below the previous January lows, and also below the December and late-November lows. How did gold respond?
(Click on image to enlarge)
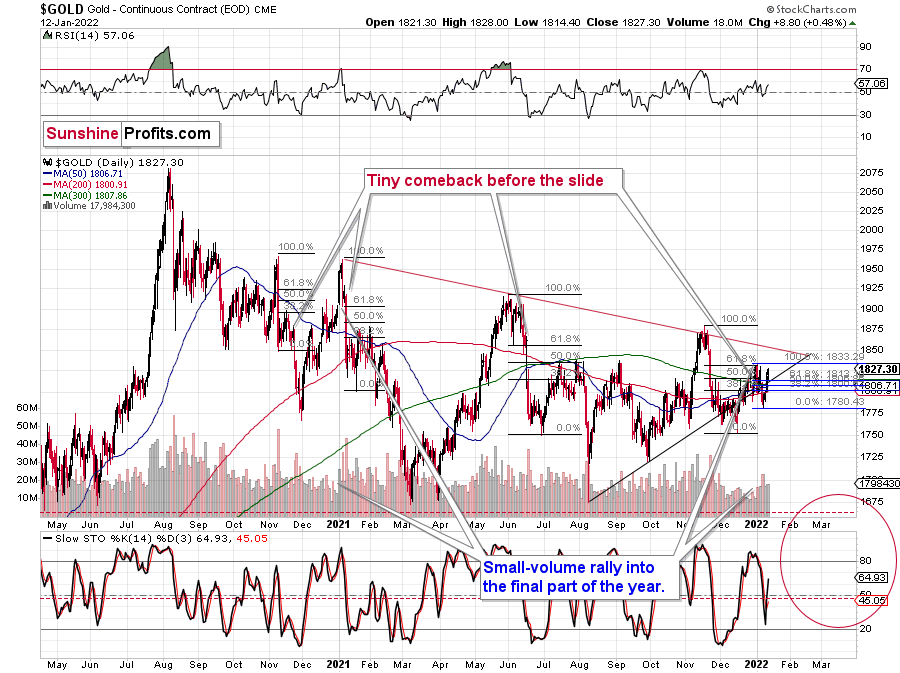
Gold rallied – but just by a mere $8.80. While gold got close to its early-January high, it didn’t manage to move above it. 2022 is still a down year for gold. Also, gold is clearly below its November 2021 highs, when it was trading close to $1,900.
Is gold showing strength here?
Absolutely not.
Gold is showing the opposite of strength. It’s weak and unwilling to react to the USD’s weakness. That’s exactly what I want to see as a bearish indication if I plan on entering a short position in the precious metals sector or when I’m timing an exit of a long position, or as a confirmation of a bearish narrative in general.
So, yes, of course I want to say that yesterday’s rally in gold was a bearish development. That’s the case, because gold should have rallied so much more, given what happened in the USD Index. Today’s overnight action makes the bearish case even clearer. The USDX is down a bit, but gold is down too, anyway. It simply doesn’t want to rally. Gold wants to decline instead.
Mining stocks and silver behaved similarly to gold yesterday – they didn’t move to, let alone above, their previous 2022 highs. Consequently, they confirm the indications for the gold vs. USD dynamic – they don’t point to something else.
Summing up, the outlook for silver, gold, and mining remains bearish for the medium term, and this week’s rally seems to be nothing more than a counter-trend breather.
Disclaimer: All essays, research and information found on the Website represent the analyses and opinions of Mr. Radomski and Sunshine Profits' associates only. As such, it may prove wrong ...
more

