
The Problem With The Modern Gold Miner
If you are a gold bug, you have marveled lately at how historically cheap gold stocks have gotten relative to about everything: (click on images to enlarge)

Here we see that, despite gold climbing from $35 in 1968 to about $1250 today, the gold miners have dived the opposite direction from the metal price in each of the two big gold bull markets, from 1970 to 1980 and our present one starting in 2000. The mining stocks climbed, but badly under-performed the metal in both bull markets. Note that the two big dives in the above chart were during the bull markets and that our modern bull under-performed at a much lower lever that the previous bull of the 1970's. And they have certainly underperformed stocks in general, having turned back down to the relative level they were at at the beginning of the gold bull market:
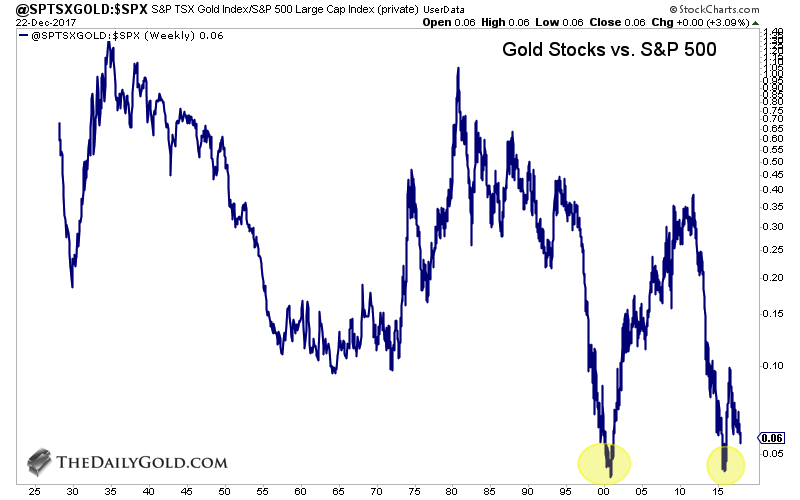
Here we see that in the 1970's bull market, the gold miners solidly out-performed your average stock. But in our modern bull market, the miners started to out-perform, then something went horribly wrong and sent the miners spiraling back to where they were before the gold bull began in 2000, despite the price of gold hanging on to its advance from $300 to the mid $1000s today.
In our modern world, the big driver of gold stocks is supposed to be the proliferation of fiat money. But the miners haven't even performed relative to fiat money:

Here we have the gold price plotted vs FMQ (Fiat Money Quantity) and we see that the 1970's gold bull, which wasn't about fiat, solidly out-performed fiat money. Then the proliferation of fiat really began in the year 2000, when our present gold bull began:

Gold really didn't respond much to fiat, however, now being at the level in 2000 as if there were no modern fiat problem. FMQ took a sharp turn upward shortly after 2005, the same time the gold stocks began their turn south. The chart is for the metal price, so the miners, as seen in the above charts, have been way under-performing gold and thus very severely under-performing the proliferation of fiat money.
In these charts, one has to wonder just what is going horribly wrong with the modern gold miners, especially since about the year 2005. This seems to be the juncture where a disconnect began between a gold miner and everything it is supposed to be responding to. If you look again at the charts, you see that is about the time when the wheels started falling off.
Gold mining, as with any mining, is a very difficult and complicated business and a lot of things go into determining their stock price performance. I don't want to oversimplify all that, but in this article, I want to look at just two things that I think go a very long way in explaining what we see in the charts above. These two things are very related and are governed by something that no government, economist, or council can fix. So we are pretty much stuck with both of them as they both will only get worse in the future.
The first thing is the price of oil. The primary job of a miner is to burn massive mounts of energy to extract massive amounts of ore and pulverize it into a few grams of precious metal. If you look at the history of oil, you see what the year 2005 means:
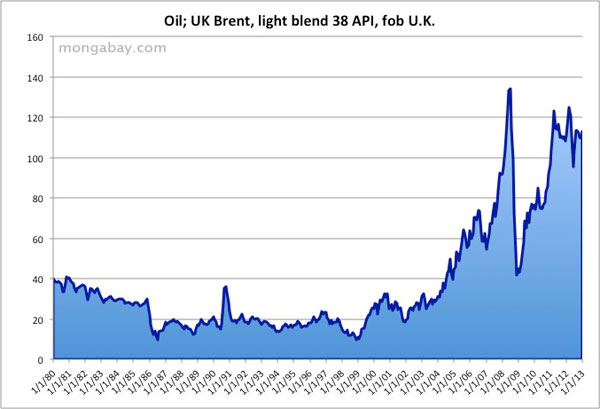
That was the year oil made the permanent break above the $30/bbl ceiling on decades of cheap energy. This has put the miners' cost structure into a world of hurt and at least partly explains why miners badly underperformed the gold price in the above charts in both gold bull markets. In the first bull, to the left of the above oil chart, oil had climbed from the standard $3/bbl price in the 1960s to $40/bbl in 1980 because of all the Middle East troubles.
Then starting in 2000, along with our present gold bull, oil takes off again. Both humongous climbs in oil put a severe damper on the gold miners' fortunes in both of the gold bull markets, helping them to under-perform the metal in the BGMI index above.
The oil problem becomes compounded with its evil twin, the other big problem with the modern gold miner - declining ore grades:
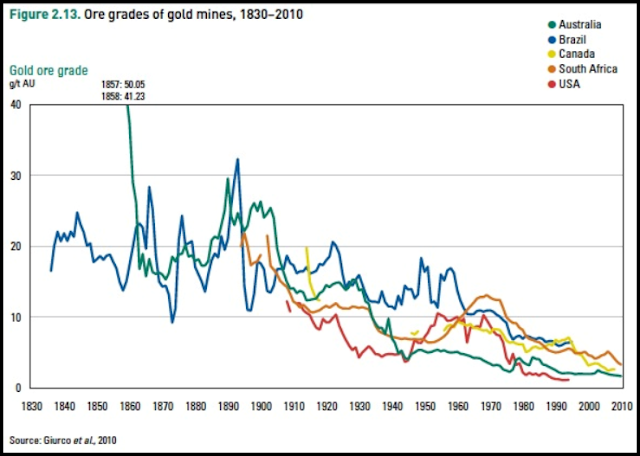
Gold content has fallen to about 1/10th of what it was in the 1970's - 1.18 g/t (grams per ton) per this report and quickly heading below 1.0 to the reserve figure. This may also be a big reason why miner stocks have not kept up with the metal price in this bull market:
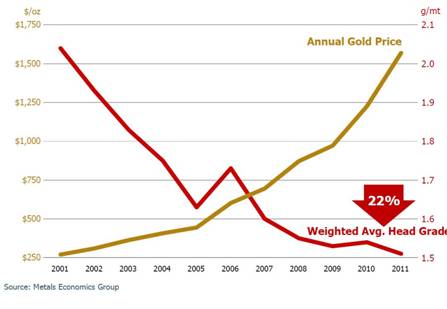
If you take just the basic miner function of buying energy to extract grams of gold and look at how that cost has risen since the year 2000, you must consider that oil has gone from averaging about $22/bbl the 20 years pre-2005 to about $73 the last 10 years, a 3.3 fold rise, and compound that with ore grade declining from 2 to 1. The cost of the actual act of making gold then has increased by 3.3x2 or a 6.6 multiplier. Gold would have to be at $2000/oz. now just to have kept up with that cost rise from when gold really started its climb from $300 to now.
This is not the total cost for mining, of course, with energy accounting for around 20% of typical reported miners' costs. But it presents a bulging cost wad that miners have constantly got to be compensating for with cuts elsewhere. And that's hard to do. They must constantly be replacing their pipeline of new gold and that's costly and tough because all the good stuff has already been found:

The subject of "real" miners' cost is complicated and prompted the World Gold Council and miners, in 2013, to come up with AISC (All In Sustaining Cost) which accounts for some indirect costs. Direst costs are more easily measured, such as diesel usage. This study found a total diesel cost per ounce of gold produced going from $18 in 2003 to $101 in 2013. It was for the top five gold miners, who have more means to adjust other costs than the more typical miner, bringing the above mentioned 6.6x factor down to around 6X for their actual net cost increase for the act of making gold from ore, via the diesel usage.
A new giant study just out (July 10) by Goldmoney looks at the real energy cost of gold production, both reported and unreported in a very comprehensive tabulation of real cost, and the difference between direct and the rest. Their result may surprise you - it did me.

Here we see a big range in direct costs from mid-teens to 49%. But this is for 2016, where we had low oil and the average price was only $43/bbl - very low for these days. And the report echos the view that your average miner cost is probably much higher than those of the top 25:
"Importantly, these are the largest gold producers in the world. They are not the fringe producers that operate at the margin ... It is reasonable to assume that many of these companies have higher energy exposure than the largest traded gold producers we analyzed in this report."
So the average direct cost of these 25 miners, which is 20%, must be bumped up by at least a 71/43 ratio to get what these costs have been really averaging the last 6 years at a $71/bbl average Brent price. That comes to 33% for direct costs instead of 20%.
To add on the indirect costs, they do a thorough look at all the oil related costs, such as the giant tires those big-as-a-house transport trucks use. Each of those tires takes 50 barrels of oil to make. A big miner, like Barrick, for example, goes through 6,000 of those tires a year. At $67 oil, that's $20 million a year they are spending just on the oil in those tires. After accounting for a vast array of such factors, they conclude the study with this:

Considering that the average miner energy costs are higher than for the top 25 of this study, and that their data seems centered around the year 2016, a year of lower than average oil price, you'd have to say the miners' energy costs are actually averaging well over 50% of their total costs per this study. This helps to explain the sharp turn in the miners' fortunes shortly after 2005, the pivotal year in energy.
These two big problems, higher oil and lower grades, are both facts of geology that are not going to go away. US shale will go into the downside of its Hubbert curve at some point and will not keep a lid on oil prices forever. So why would anybody in their right mind buy a gold miner today if you're not betting on a $5000 gold price anytime soon?
It has to be done very carefully with all the above in mind. For instance, acquiring the remaining high grade properties, which is the name of the game in modern times, is best done by clever acquisition, not spending a fortune on an exploration budget. You can't do much about higher oil, but you can make sure your miner has ultra high grade ore presently and will seek nothing but high grade in the future. Grade is the key to gold mining today.
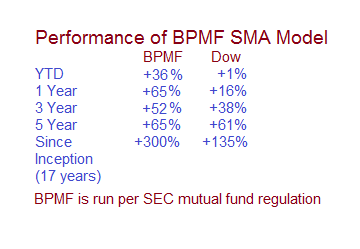
There is a mid-tier gold miner that is behaving like the best of the growth stocks with about the highest grade properties on earth and AISC the cheapest to be had. Since 2014, they have increased revenue by 4.9 fold, cash flow from operations by 12.8 fold, and EBITDA by 17.1 fold and sell at a 24 PE. Their stock chart is a copy of that of Netflix over the last three years, a smooth ascent to a 3 fold rise, despite the stagnant gold price. Their properties, both producing and soon to be produced, have ore grades more reminiscent of the 1920s than today. They are debt free and executing aggressive growth with robust cash flow. I just wrote an article at Forbes on this miner and you can read it here as well as see some information on our SMA (Separately Managed Accounts) offered by Marketocracy and FOLIOfn Institutional. I run a model fund for this, where I own this gold miner. It is the only gold miner I own, except for a very small handful that are mainly copper. Some performance stats on my model (as of 7/13/18):
If you've never checked out SMAs, you should. They offer some advantages of hedge funds (manager's own money invested) but with far more safety (models are per SEC mutual funds) and your account is entirely separate and your own (synced to the models you want) with over a dozen models to choose from, all with hard-to-find, exceptional, long-term track records, carefully chosen from over 30,000 competing fund managers.
Studies have found that about two thirds of all stock funds don't survive over 15 years due mainly to poor performance. Of those that do, less than 5% even match the Dow, let alone beat it. Those survivors that handily beat the Dow beyond 15 years are among the top 1%. These SMAs can do the hard work of finding the good long-term managers for you.
Your separate account can be a Roth or any tax advantaged type you want. Customization and control on what's in your account are driving an explosive growth in SMAs, having grown by 84% since 2010, according to this report by Morgan Stanley.
I am long some gold miners.


I'd like to post a correction. In the BPMF data, I was going by some charts that are part of a switchover to the FOLIOfn website and they were showing some incorrect data. The YTD figure is +10% and one year is +32% and 5 year is +35%. Since inception is correct.