
The One Thing Foreshadowing Silver’s Next Move
Gold moved higher yesterday (Feb. 22) and so did the rest of the precious metals sector. But as you will see below, this didn’t really change anything. And there’s one detail that actually perfectly fits this kind of movement. Let’s take look at the charts, starting with the key one – and no, it’s not the one featuring gold.
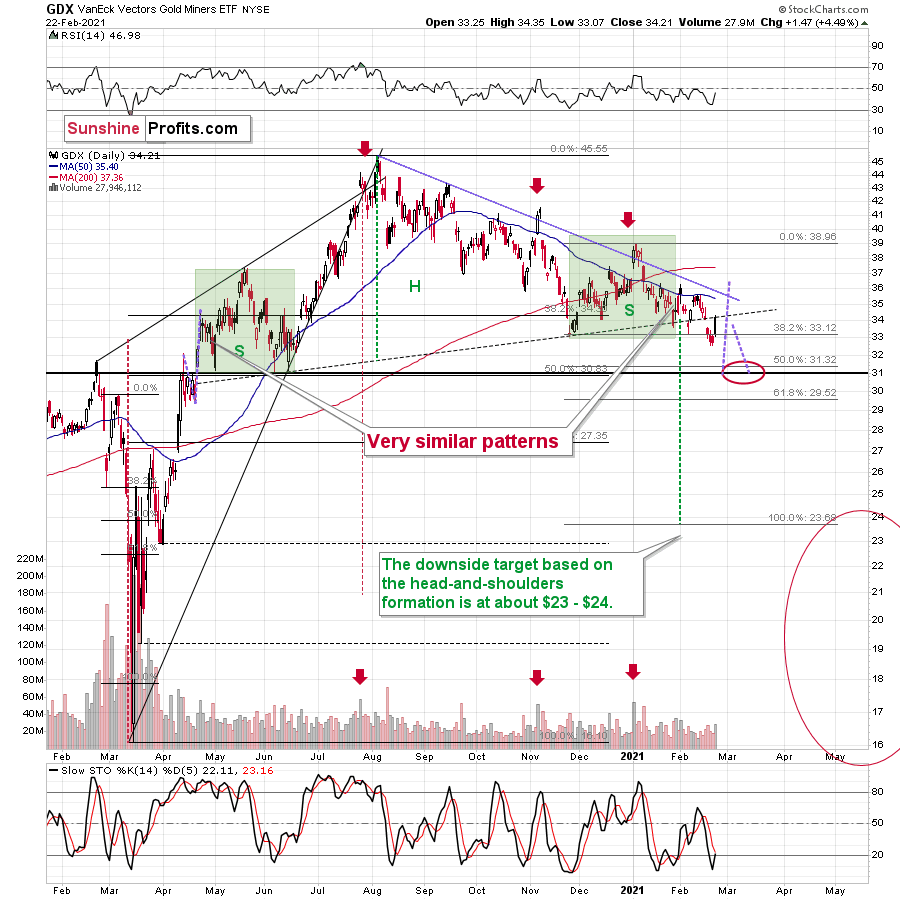
Figure 1
Despite yesterday’s (quite sharp for a daily move) upswing, the breakdown below the neck level of the broad head-and-shoulders remains intact. It wasn’t invalidated. Consequently, all its bearish implications remain up-to-date.
Having said that, let’s move to the detail that actually fits what happened yesterday (and so far today). Namely, silver is going through a triangle-vertex-based reversal at the moment.
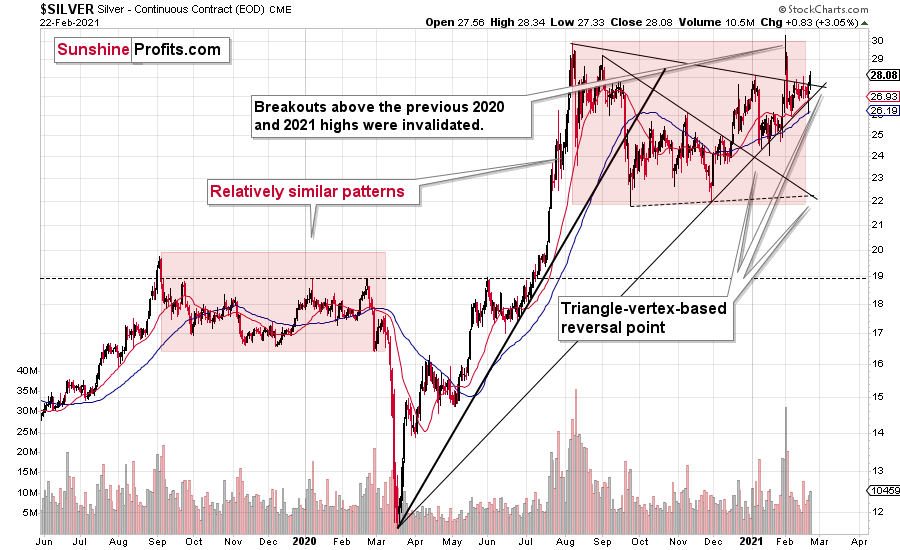
Figure 2
Indeed, after moving slightly above yesterday’s intraday high in today’s overnight trading, silver moved back down. The move lower is not yet super significant, but given the reversal point, it could just be the beginning. Remember the triangle-vertex-based reversal at the beginning of the year? Back then, practically nobody wanted to believe that silver and the precious metals market was topping at that time. It was the truth, though. Gold and mining stocks were never higher since that time and the same thing would have most likely happened to silver if it wasn’t the #silversqueeze popularity that gave it its most recent boost.
Now, there’s also another triangle-vertex-based-reversal in a few days, and since these reversals tend to work on a near-to basis, silver might top any day now, even if it hasn’t topped earlier today.
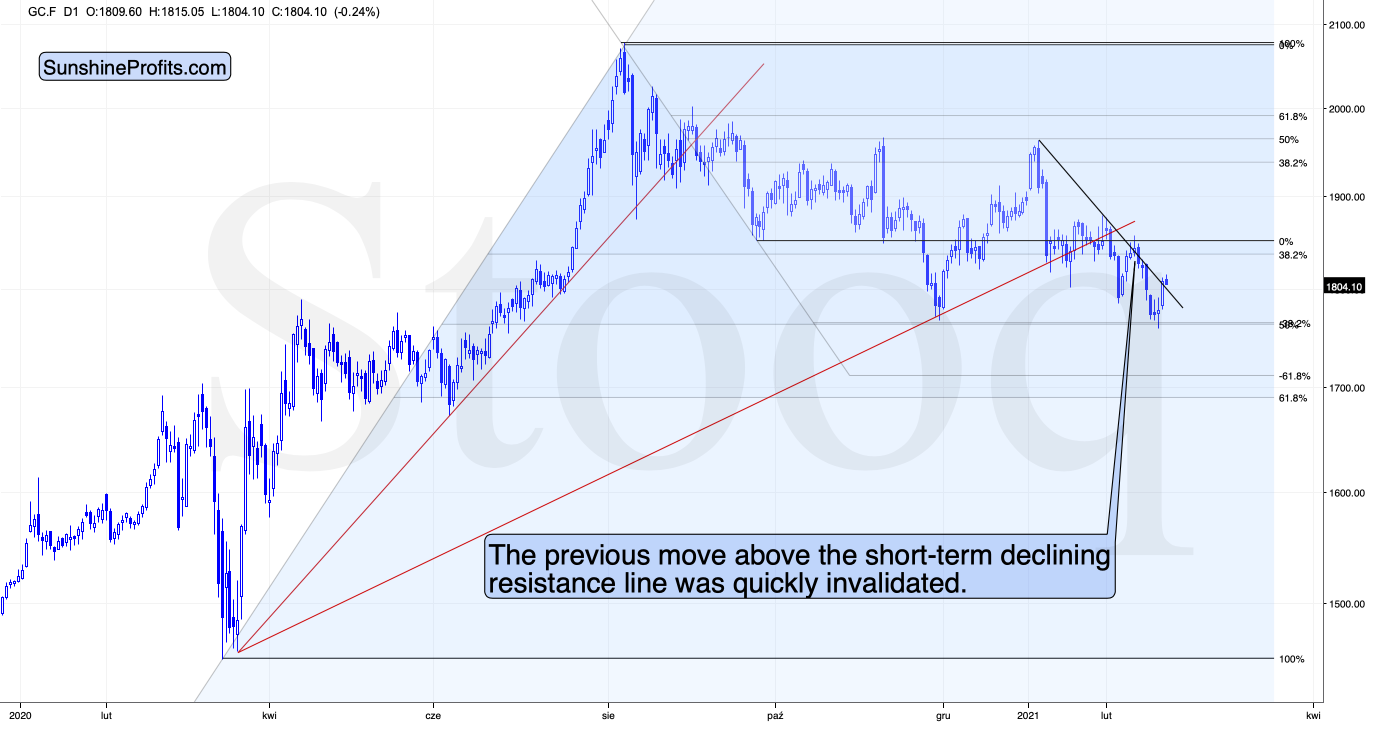
Figure 3
The move higher in gold was notable, but nothing game-changing. The last time gold moved above the declining short-term resistance line, was when it actually topped. The invalidation of the breakdown marked the start of another very short-term decline. The small decline in today’s overnight trading might be the very beginning of this invalidation that leads to another slide.
Also, you might be wondering if the decline in the USD Index made its outlook bearish.
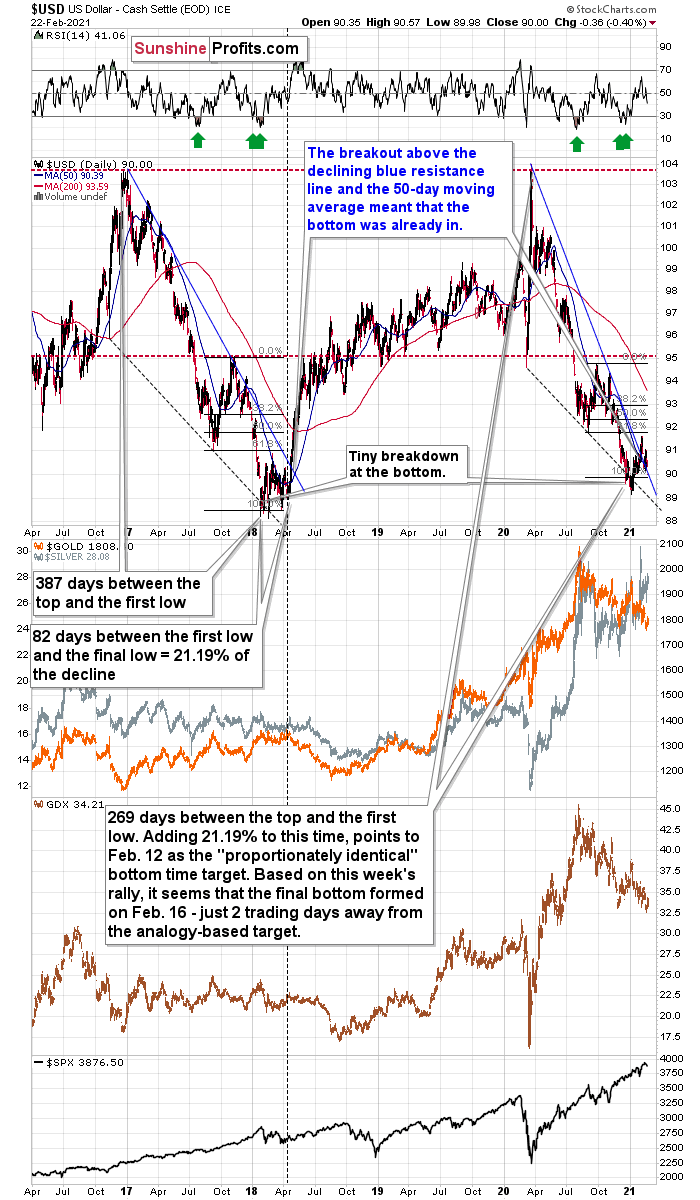
Figure 4
In short, it didn’t. The decline is still a part of the verification of the breakout above the declining medium-term resistance line that I marked with blue (figure 4). Based on the obvious similarity to early 2018, the verification of the breakdown is likely the final step before a major rally in the USDX. This will likely translate into lower precious metals and mining stock prices, especially if the general stock market declines as well.
Disclaimer: All essays, research, and information found on the Website represent the analyses and opinions of Mr. Radomski and Sunshine Profits' associates only. As such, it may prove wrong ...
more


What is not told here is how the chart has been painted, ie. is made to look this way due to massive intervention and suppression of price discovery, no?
If there wasn’t this amount of manipulation there would be no point to #silver squeeze, in other words, if true price discovery was permitted then there would be no “squeeze potential. Any one agree?
There is some truth to it - definitely. After all, no market is really free if the interest rates are not allowed to float freely. On the other hand, if the manipulation was really total, silver wouldn't be allowed to rally from below $5 to about $50 years ago...