
The Golden Fan Effect – What The Monthly Chart Revealed

Image Source: Pexels
Most traders look at candles. I look at forces.
And on the monthly chart? There’s a geometry that’s quietly been guiding price for years – a Fibonacci fan drawn from a time most have already forgotten.
This isn’t just about lines. It’s about pressure arcs.
And right now?
Gold is brushing against the outer rim of a long-term arc.
Subtle. Rare. Significant.
Let’s decode it.
(Click on image to enlarge)
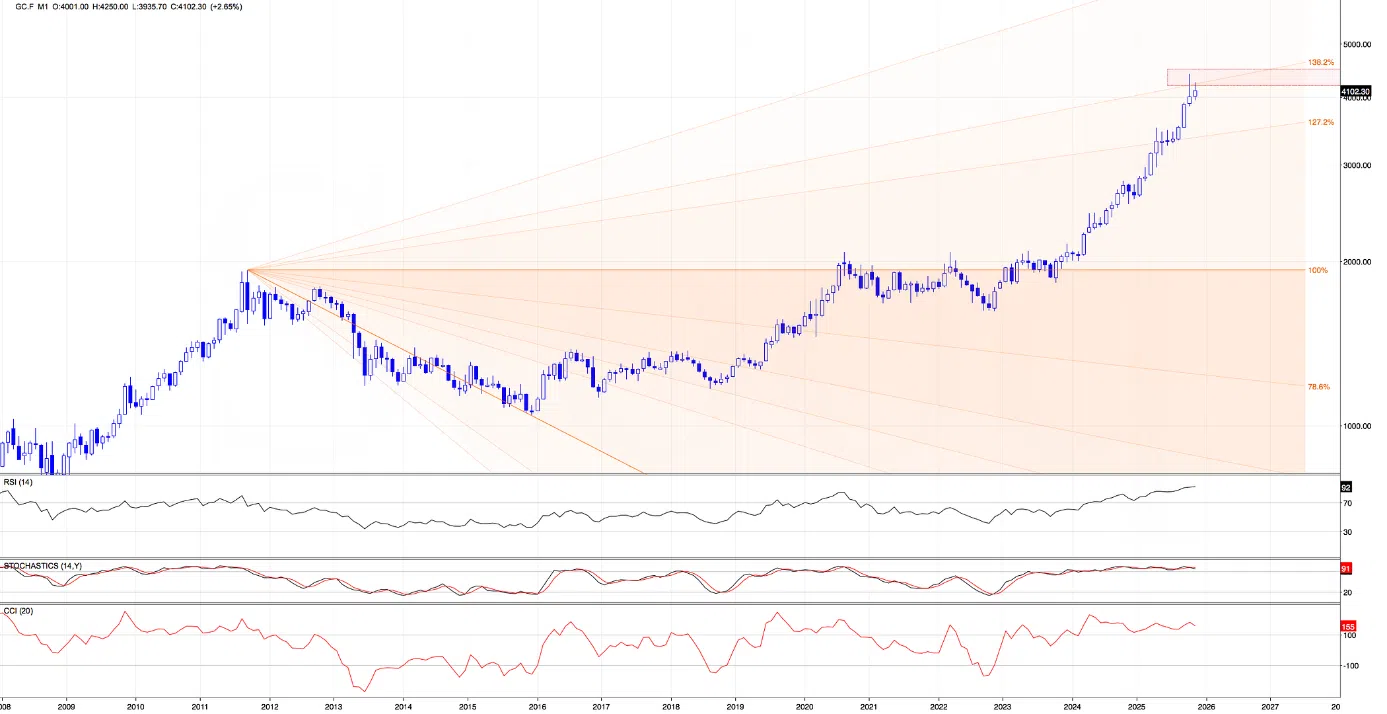
Here’s what we’re seeing – Fibonacci Fan.
This tool isn’t often used in daily swing trading, but on monthly charts. It’s a hidden gem and here’s why.
The Fibonacci Fan draws dynamic, diagonal support and resistance lines based on the initial swing – in this case, the 2011 high to the 2015 low. These rays act almost like gravitational fields: the price tends to react, slow or accelerate as it approaches each one.
And right now?
Gold just tapped the 138.2% Fibonacci extension – the final arc on the above chart, which together with the psychologically important barrier of 4500 creates interesting resistance zone.
This is massive deal. Why?
Because every prior arc has either paused or redirected price – and this one just triggered a clean monthly rejection wick off the top.
Additionally:
- RSI is holding at 92 – extreme
- Stochastics: ticking lower from an overbought zone
- CCI: rolling from above 150 – one of the highest readings in the last decade
What does it mean?
In my opinion, we’ve officially entered an exhaustion territory and it’s time for caution, not euphoria. This doesn’t mean the top is in forever. But it does mean this is where risk-to-reward shifts and precision matter more than ever.
More By This Author:
Oil: Quick Update
Which Way Next For Crude Oil?
Gold Futures And Fresh Peaks
Disclaimer We know you take responsibility for your trading and investment decisions, but the fine print is still necessary. To err is ...
more

