
As predicted, gold stocks are gradually declining. Their situation is unlikely to improve - the Fed is already planning another interest rate hike.
After yesterday’s huge slide in the PMs (GDXJ declined by over 8%!) and a sizable increase in our short positions in junior miners, gold and silver are moving back and forth, gathering strength for the next move. Or waiting for the next trigger.
They are likely to get it tomorrow (Wednesday, June 15), as the Fed is about to make another interest rate decision. The word got out yesterday that the Fed might hike interest rates by 0.75% instead of just 0.5%, and the markets reacted accordingly. Stocks and PMs fell, while the USD Index rallied.
The best part is that you knew about the bigger rate hike before almost everyone else – I wrote about that in the extra analysis that I posted/sent out on Saturday. Quoting:
The next interest rate decision is this Wednesday, and it’s probably going to be very interesting. I wouldn’t be surprised if we saw a rate hike by more than 0.5% - for example by 0.75%. This might be enough to send a message to the market that they are serious about inflation and have positive political implications. Whether that happens or not, the following conference will likely aim to rebuild investors’ confidence in the Fed. It might or might not work with regard to confidence, but it should be enough to trigger declines in the markets (including PMs) – after all that’s how hawkish surprises work.
Okay, so, the precious metals declined significantly, and now they paused. What’s next?
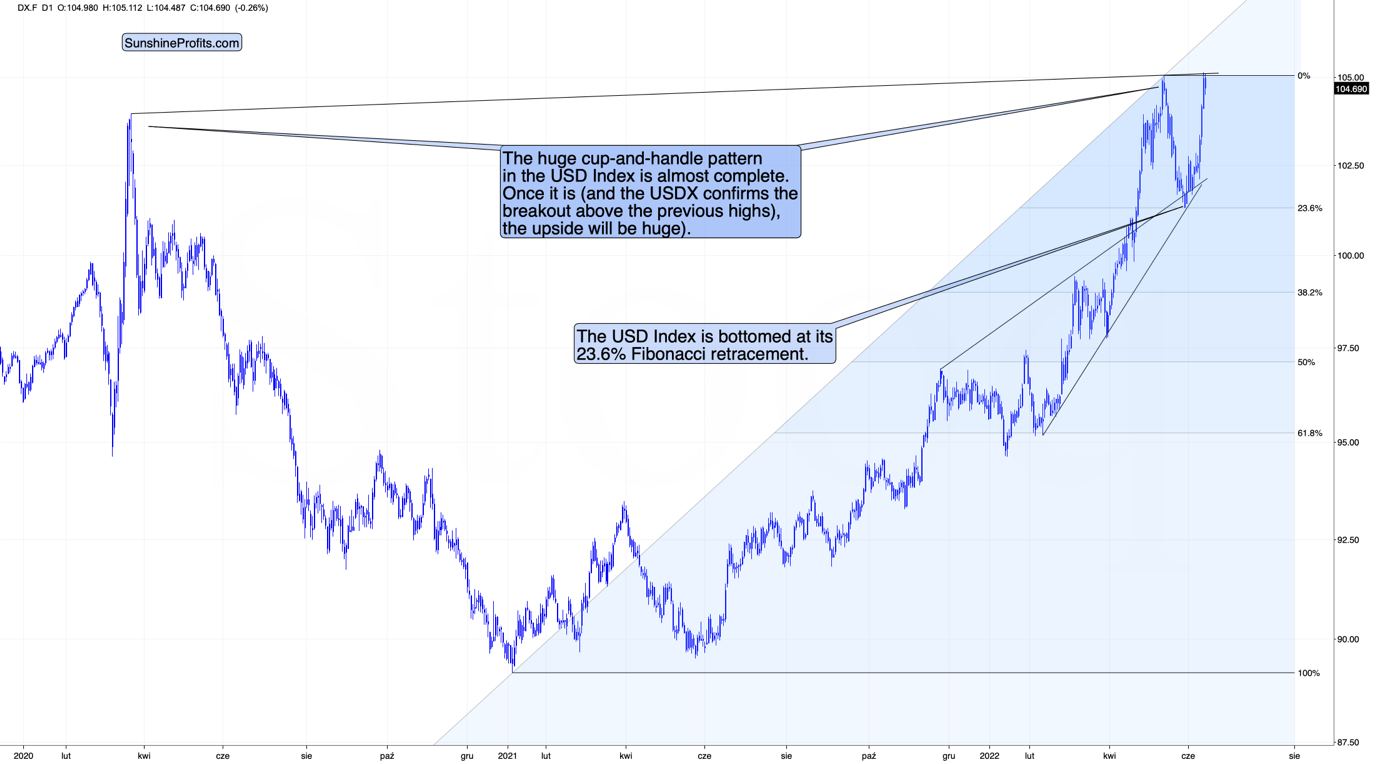
Well, they might take a breather today, but since the interest rate decision is tomorrow and – in my view – a 0.75% rate hike is indeed likely along with some hawkish rhetoric, the markets might tumble even more (and the USDX would be likely to rally further).
While in the case of the USDX it will likely imply a breakout above the big cup-and-handle pattern, in the case of the precious metals sector, it would likely open the way to another huge wave down.
(Click on image to enlarge)
In today’s analysis, however, I’d like to step back from my usual day-to-day comments (my previous thoughts on the market remain up-to-date) and feature a specific lesson from the 2008 decline that might be useful during the current slide.
To clarify, there are no guarantees that history will repeat itself, and I don’t guarantee any kind of performance, but history does tend to rhyme, so what we’ve seen so far might be a useful indication of what’s next.
First, let me emphasize that gold stocks are declining similarly to how they did in 2008.
(Click on image to enlarge)
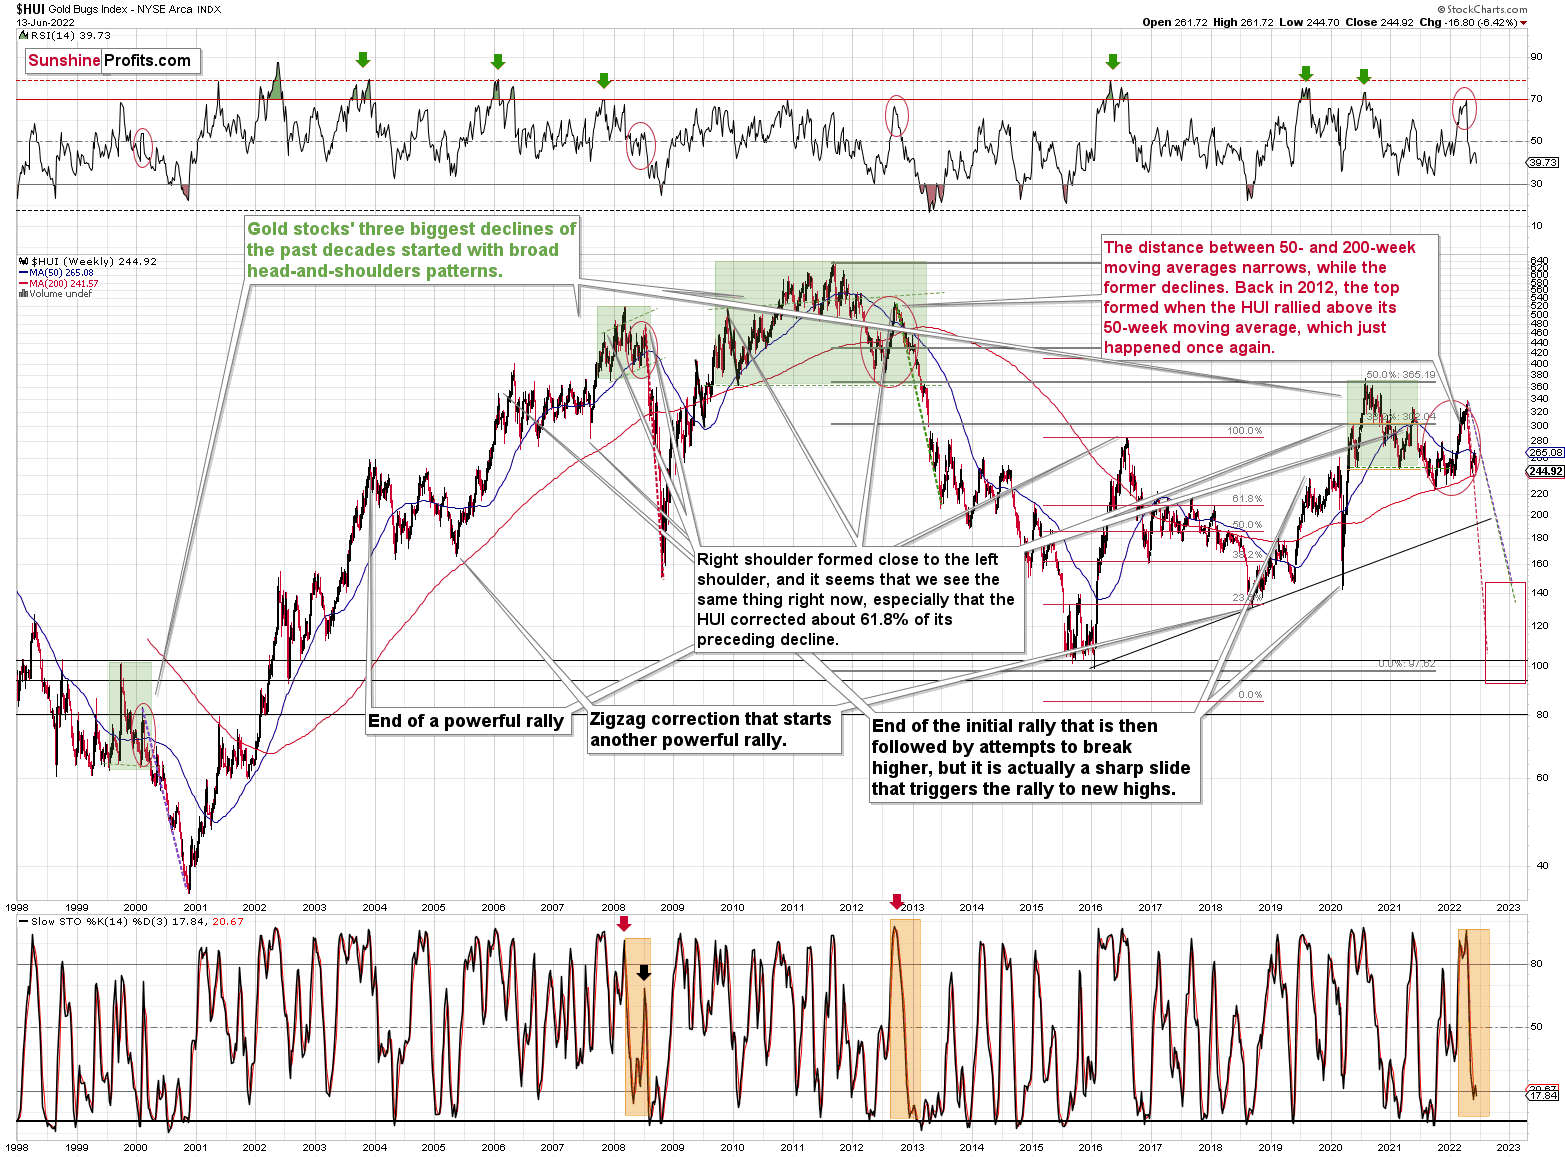
The Russian invasion triggered a rally, which was already erased, and if it wasn’t for it, the self-similarity would be very clear (note the head-and-shoulders patterns marked with green). Since the latter happened, it’s not as clear, but it seems that it’s still present. At least that’s what the pace of the current decline suggests.
I used a red dashed line to represent the 2008 decline and copied it to the current situation. They are very similar. We even saw a corrective upswing from more or less the 200-week moving average (red line), just like what happened in 2008.
All right, let’s zoom in and see how mining stocks declined in 2008.
(Click on image to enlarge)

Back then, the GDXJ ETF was not yet trading, so I’m using the GDX ETF as a short-term proxy here.
The decline took about 3 months, and it erased about 70% of the miners’ value. The biggest part of the decline happened in the final month, though.
However, the really interesting thing about that decline – that might also be very useful this time – is that there were five very short-term declines that all took the GDX about 30% lower.
I marked those declines with red rectangles. After that, a corrective upswing started. During those corrective upswings, the GDX rallied by 14.8-41.6%. The biggest corrective upswing (where GDX rallied by 41.6%) was triggered by a huge rally in gold, and since I don’t expect to see anything similar this year, it could be the case that this correction size is an outlier. Not paying attention to the outlier, we get corrections of between 14.8% and 25.1%.
The interesting thing was that each corrective upswing was shorter (faster) than the preceding one.
The first one took 12 trading days. The second one took seven trading days. The third one took 2 trading days, and the fourth and final one took just 1 trading day.
Fast forward to the current situation. Let’s take a look at the GDXJ ETF.
(Click on image to enlarge)
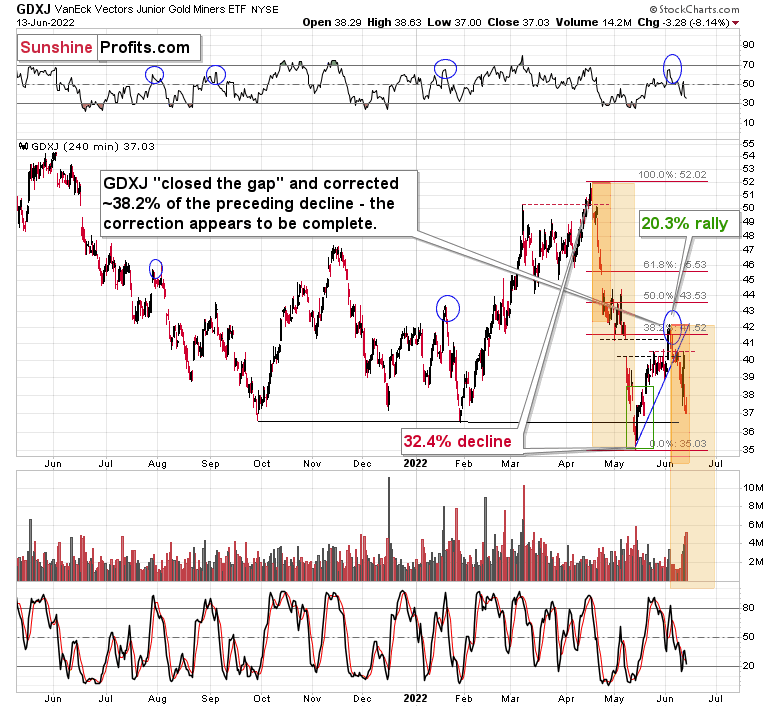
The GDXJ ETF declined by 32.4% and then corrected – it rallied by about 20.3%. The corrective upswing took 14 trading days.
The above is in perfect tune with the previous patterns seen in the GDX during the 2008 slide.
What does it tell us? It indicates that history can be rhymed, and while it will not be identical, we should pay attention to the indicators that worked in 2008. The next corrective upswing (a notable one, that is) might start when the GDXJ ETF declines by about 29-35% from its recent top. To clarify, I don’t claim that the above technique would be able to detect all corrective upswings, or that I aim to trade all of them. For instance, in my view, it was a good idea to enter a long position on May 12 and switch to a short position on May 26, but I wasn’t aiming to catch the intraday moves.
GDXJ could also decline a bit more than 29-35%, as let’s keep in mind that previous statistics are based on the GDX ETF and we are discussing the GDXJ here, and the latter is likely to decline even more than GDX as juniors are more correlated with the general stock market (and the latter is likely to slide).
So, let’s say that the GDXJ might decline between 29% and 40% from the recent high before triggering another notable corrective upswing (one that could take between 5 and 10 trading days based on how long the last one took and how big those corrections were in 2008).
The recent high was formed with the GDXJ ETF at $42.19. Applying the above-mentioned percentages to this price provides us with $24.78-29.32.
Now, is there any meaningful support level in this area that could stop the decline?
Yes!
(Click on image to enlarge)
The late-March 2020 low is at $26.62, and it provides significant short-term support within the analogy-based target area.
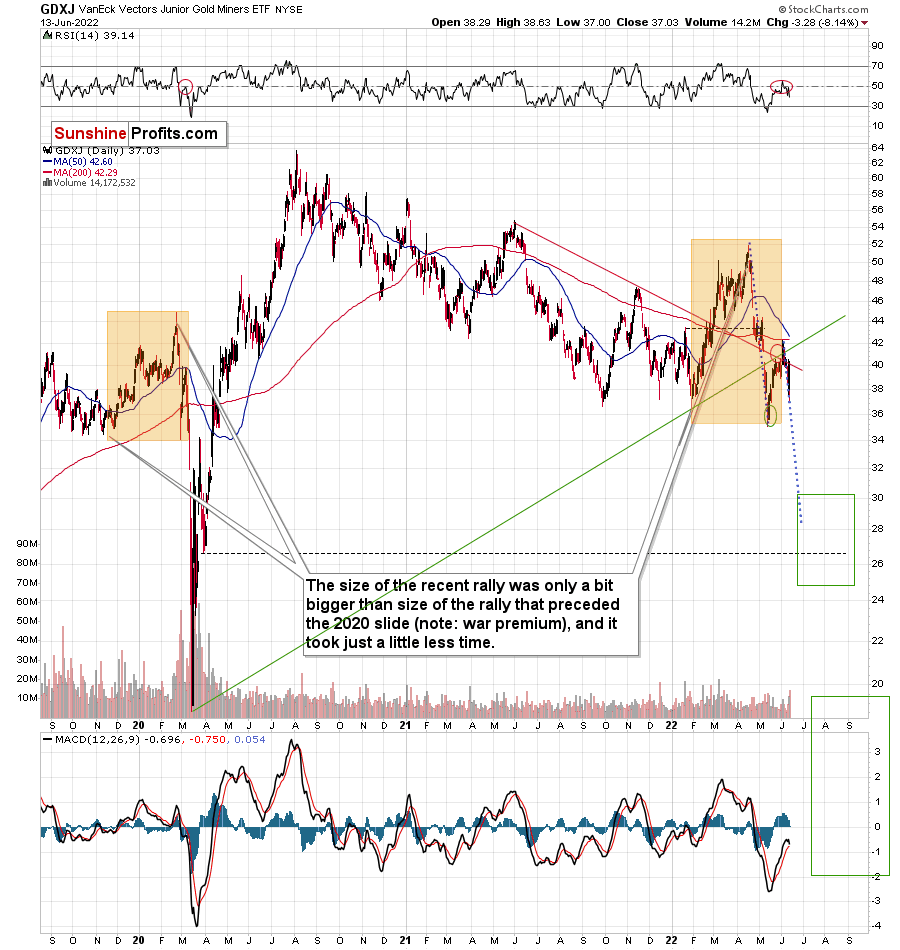
Additionally, the above correspond – more or less – to the size of the decline that would match the size of the April-May decline. It would be only somewhat bigger.
Let’s keep in mind that gold stocks don’t necessarily move on their own, but rather move along with gold.
(Click on image to enlarge)
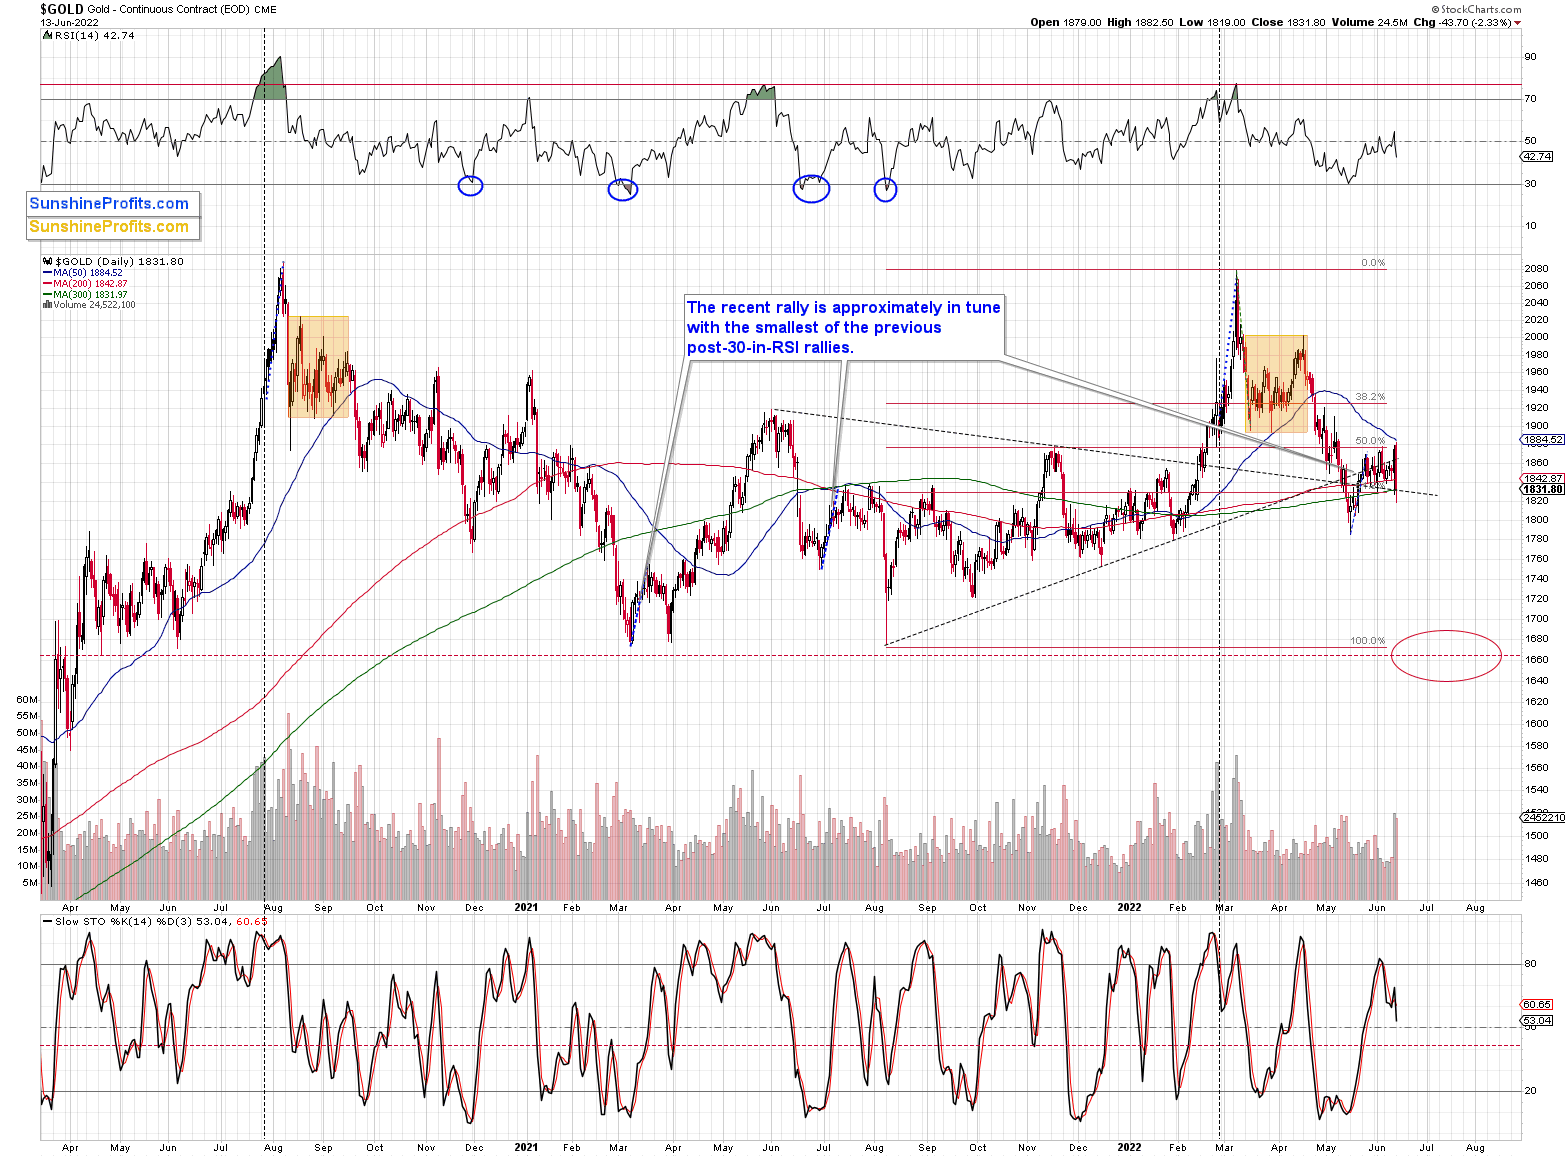
In the case of gold, a repeat of the April-May decline would imply a move to very strong support – the mid-2020 and 2021 lows. Prices below $1,700 stopped gold’s declines several times, and that would make at least a rebound likely once it’s reached that level.
Now, since the general stock market is about to slide, junior miners might be affected even more than gold, so it would make sense for one to expect them to decline somewhat more than gold (compared to what happened in April and May).
Consequently, the near-term (yes) target for the GDXJ at about $27 appears to make sense, and it seems that profits from the current short positions in the junior mining stocks will become even bigger soon.


Comments
Log in or sign up to join the conversation.