
The Comex Is In Far Worse Shape Than SVB
Given the potential impacts of the ongoing banking crisis, I will start this article with the conclusion.

The current banking crisis could not have come at a worse time for the Comex system. Inventories have seen massive depletion over the last 2+ years as investors have slowly been pulling physical out of the vaults. I have previously called this a run on the vault but labeled it as a stealthy one. As though certain investors did not want to raise the alarm, but slowly take possession while inventory was still available.
Now that confidence in the banking system has been put to the test, people will look to alternative means to store their wealth and get their money out of the financial system. The easiest and safest way to do this would be to own physical precious metals, as people have done for thousands of years.
It is likely that demand for physical metal could increase significantly in the months ahead. The futures market is already showing a massive move in the price of gold, which is knocking on the door of $2,000. It’s only a matter of time before this moves into the physical market. When it does, the Comex vault run will pick up steam.
Investors looked at SVB and saw that it was undercapitalized and people could only get 80-90 cents on the dollar. If investors were to do the same due diligence on the Comex they would find an even worse fractional reserve system in the metals market. The recent discovery by the LME that some of their inventory was stones rather than nickel should only serve as another wake-up call that the supply of physical metal is extremely tight. If everyone rushes for physical at the same time, there won’t be nearly enough to satisfy demand at current prices (silver has 15 paper ounces per 1 physical ounce!).
We could be only months away from seeing a break in the Comex system. SchiffGold will be working all weekend to take orders. Best to get physical locked in at current prices while you still can.
Current Trends
This analysis focuses on gold and silver within the Comex/CME futures exchange. See the article What is the Comex? for more detail. The charts and tables below specifically analyze the physical stock/inventory data at the Comex to show the physical movement of metal into and out of Comex vaults.
Registered = Warrant assigned and can be used for Comex delivery, Eligible = No warrant attached – owner has not made it available for delivery.
Gold
Gold is now in its 11th straight month of net outflows, seeing 285k ounces leave the vault so far in March. The exodus of metal has slowed since last year when some months saw almost 3M ounces leave Comex vaults.
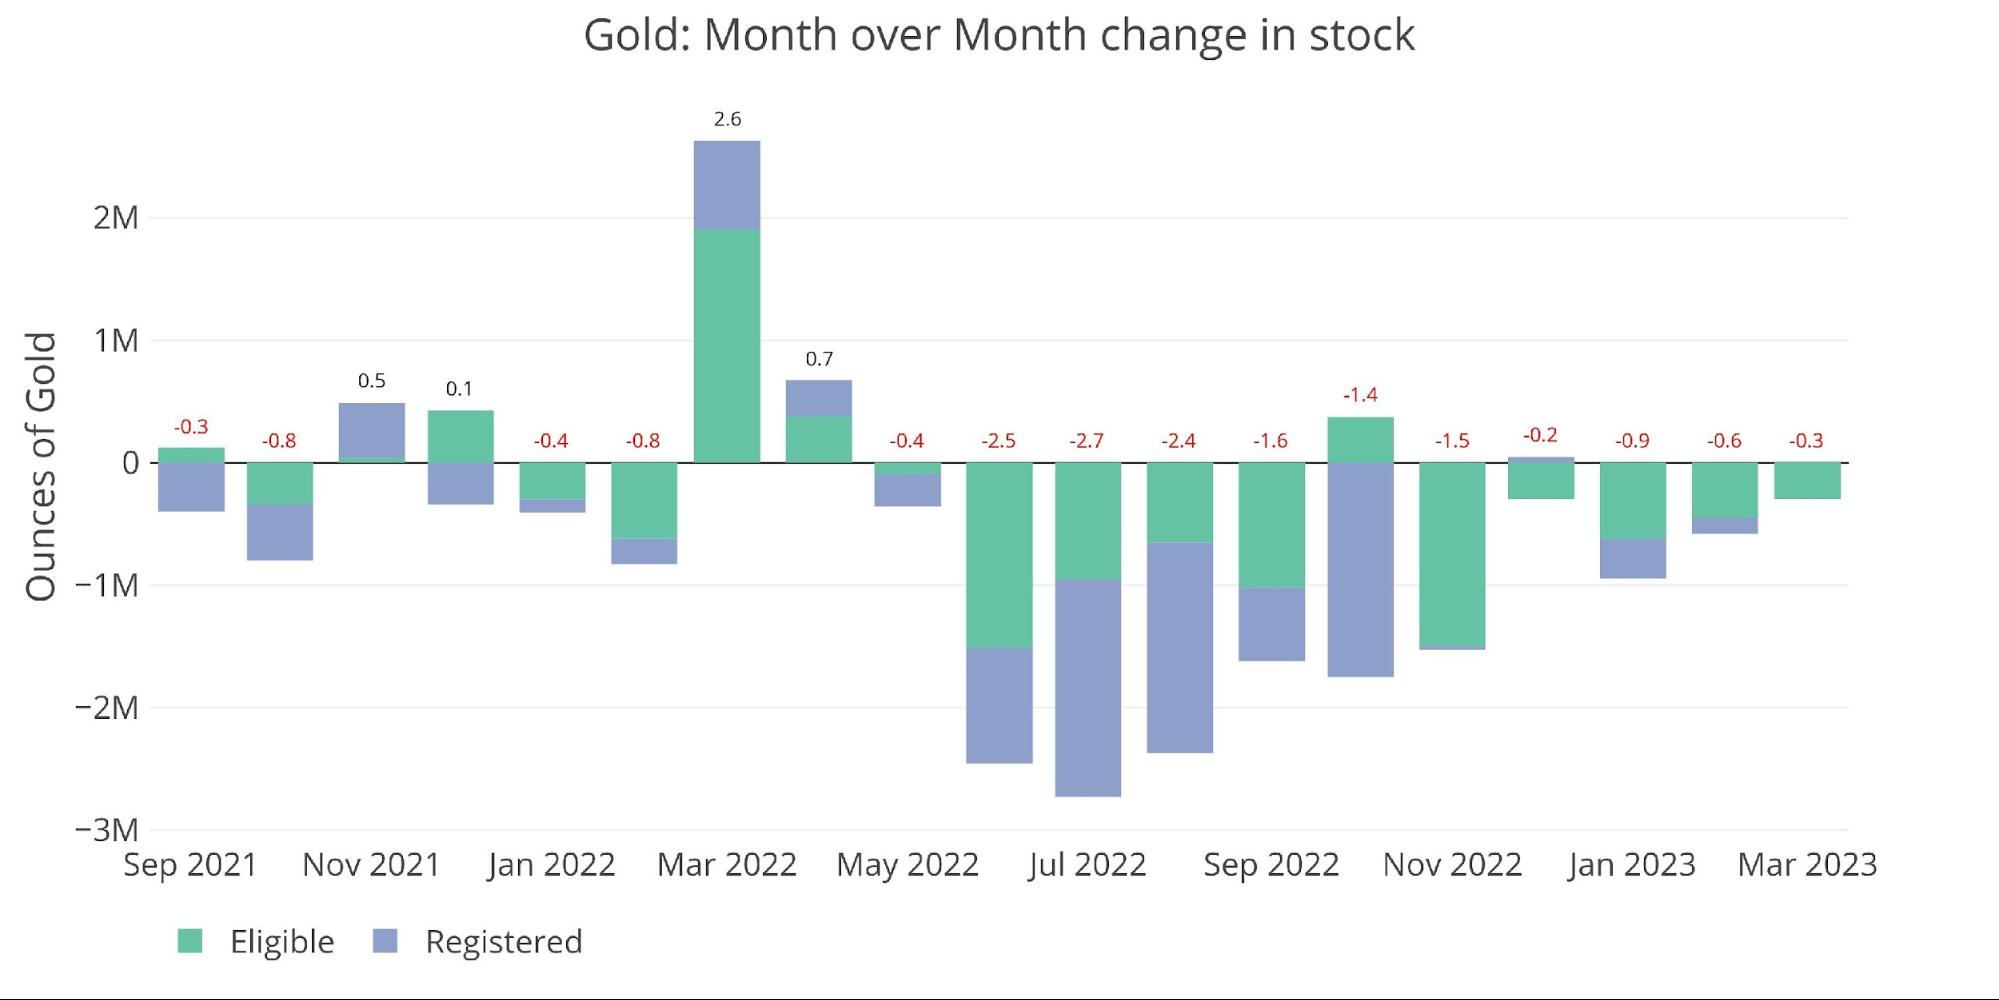
Figure: 1 Recent Monthly Stock Change
As mentioned above, this could change quickly and may already be changing! As the chart below shows, this latest week was the busiest week of outflows in the last month. Given the price of gold finished the week at $1993, the ongoing banking crisis, and general fear in the market… it seems likely that demand for physical could be ready to soar. That could drive larger outflows from Comex vaults in the near future.
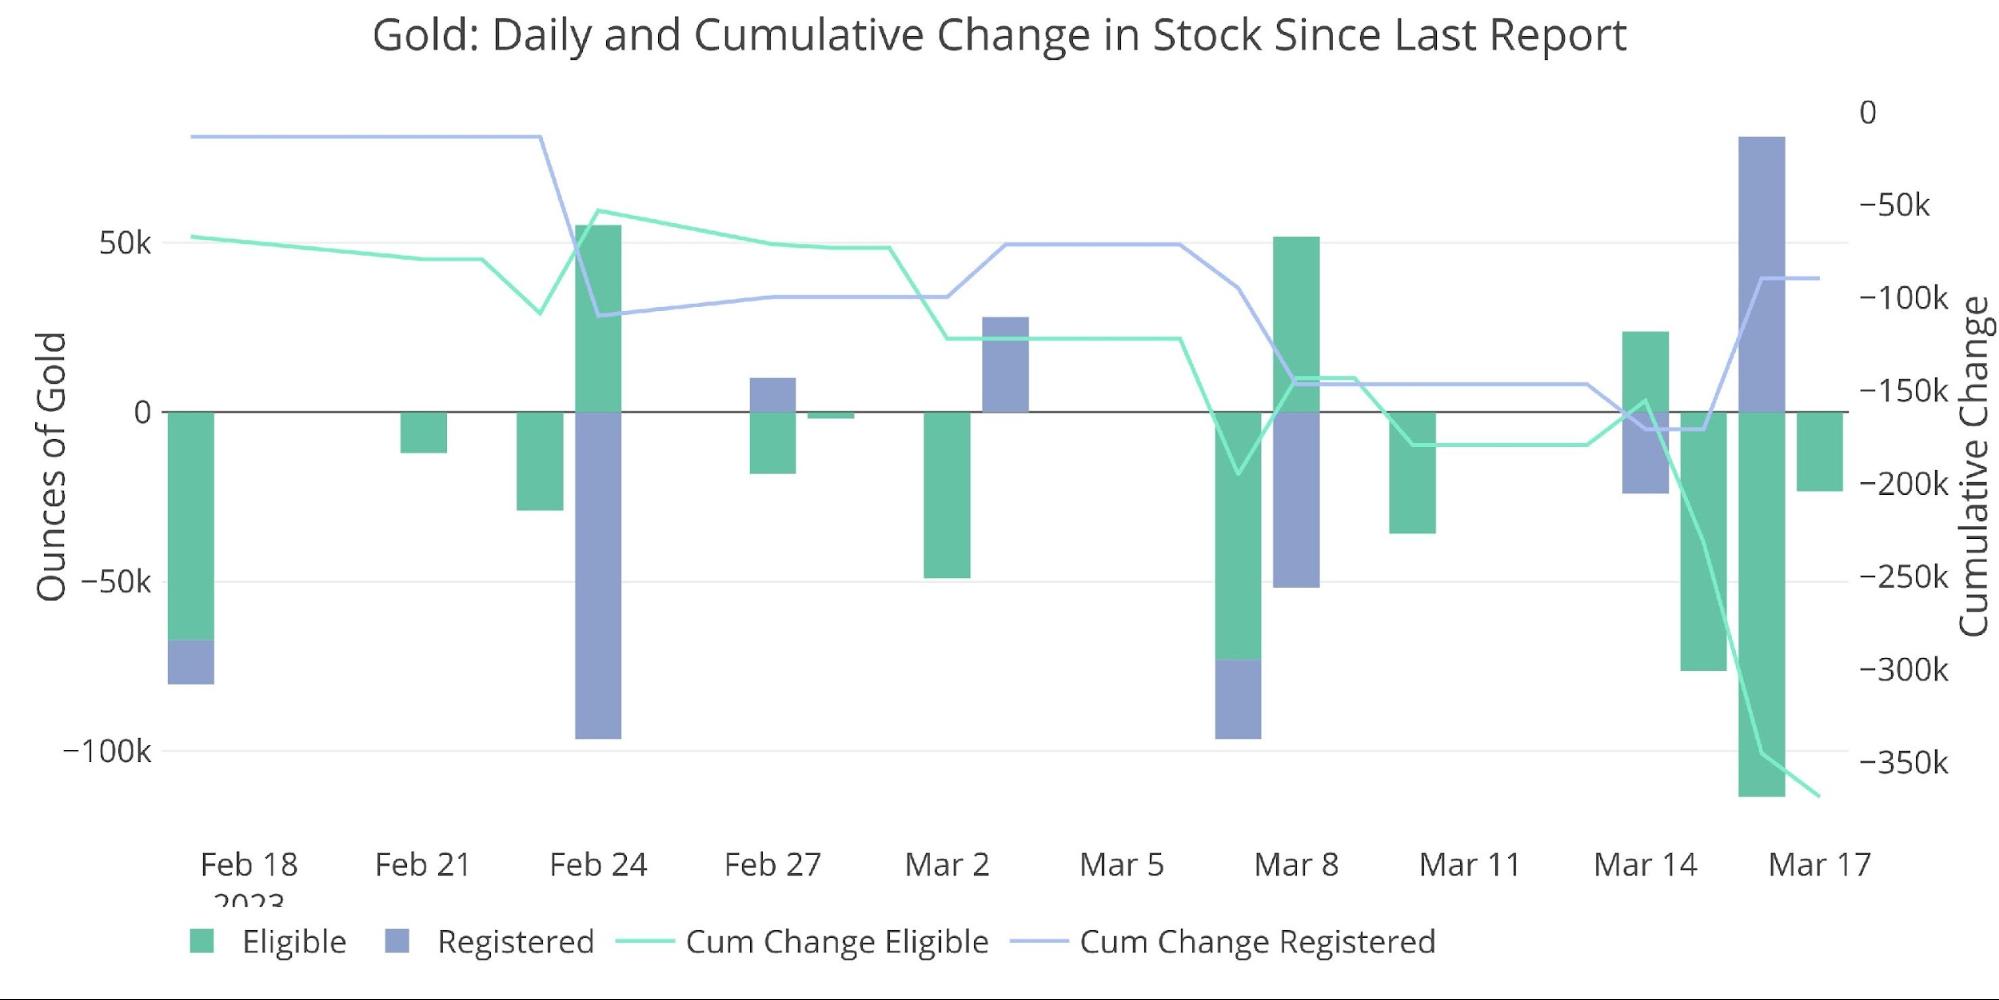
Figure: 2 Recent Monthly Stock Change
Pledged gold continues to decline, but similar to the inventory at large, the drop has been slowing.
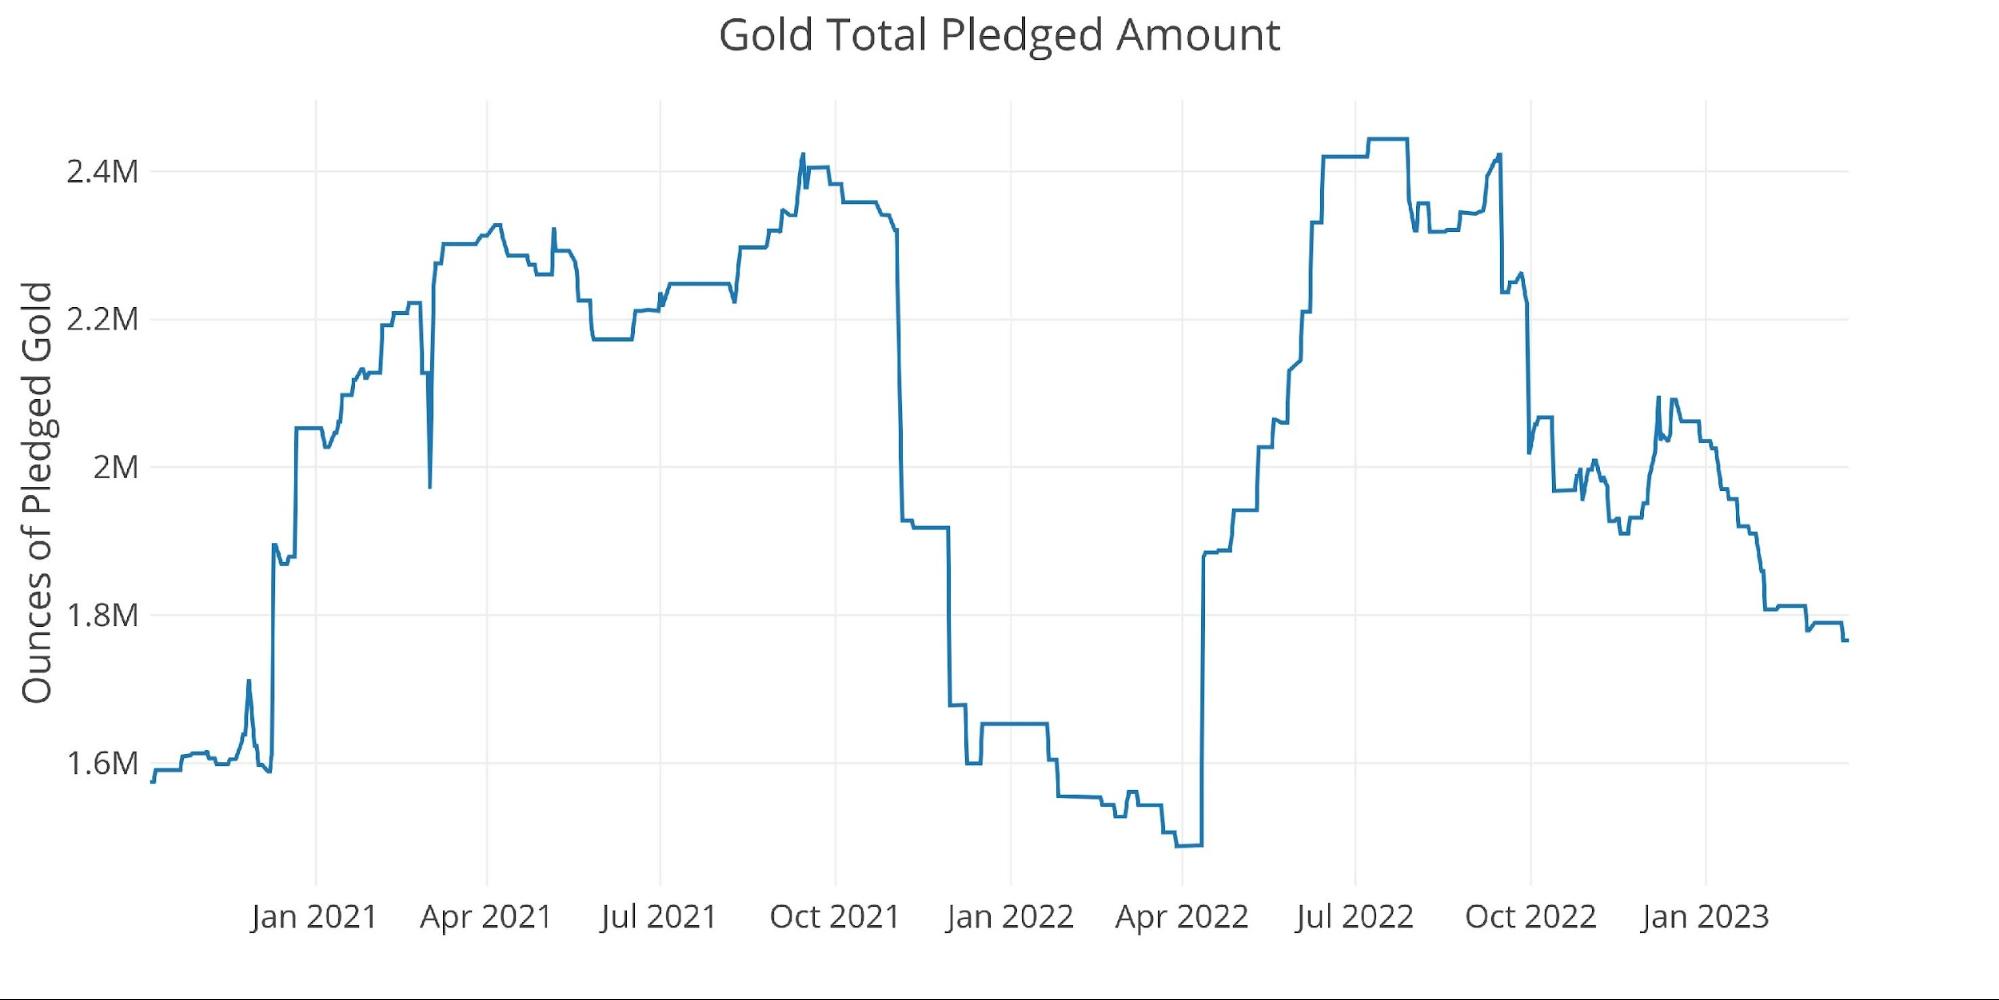
Figure: 3 Gold Pledged Holdings
Silver
Outflows in silver continue at a strong pace, seeing 3.5M ounces in outflows MTD. Registered is actually seeing inflows for the second month in a row, most likely because inventory of Registered had reached dangerously low levels. As mentioned previously, the real floor is not actually zero but somewhere higher. This is for optics to keep confidence in the fractional reserve silver trade.
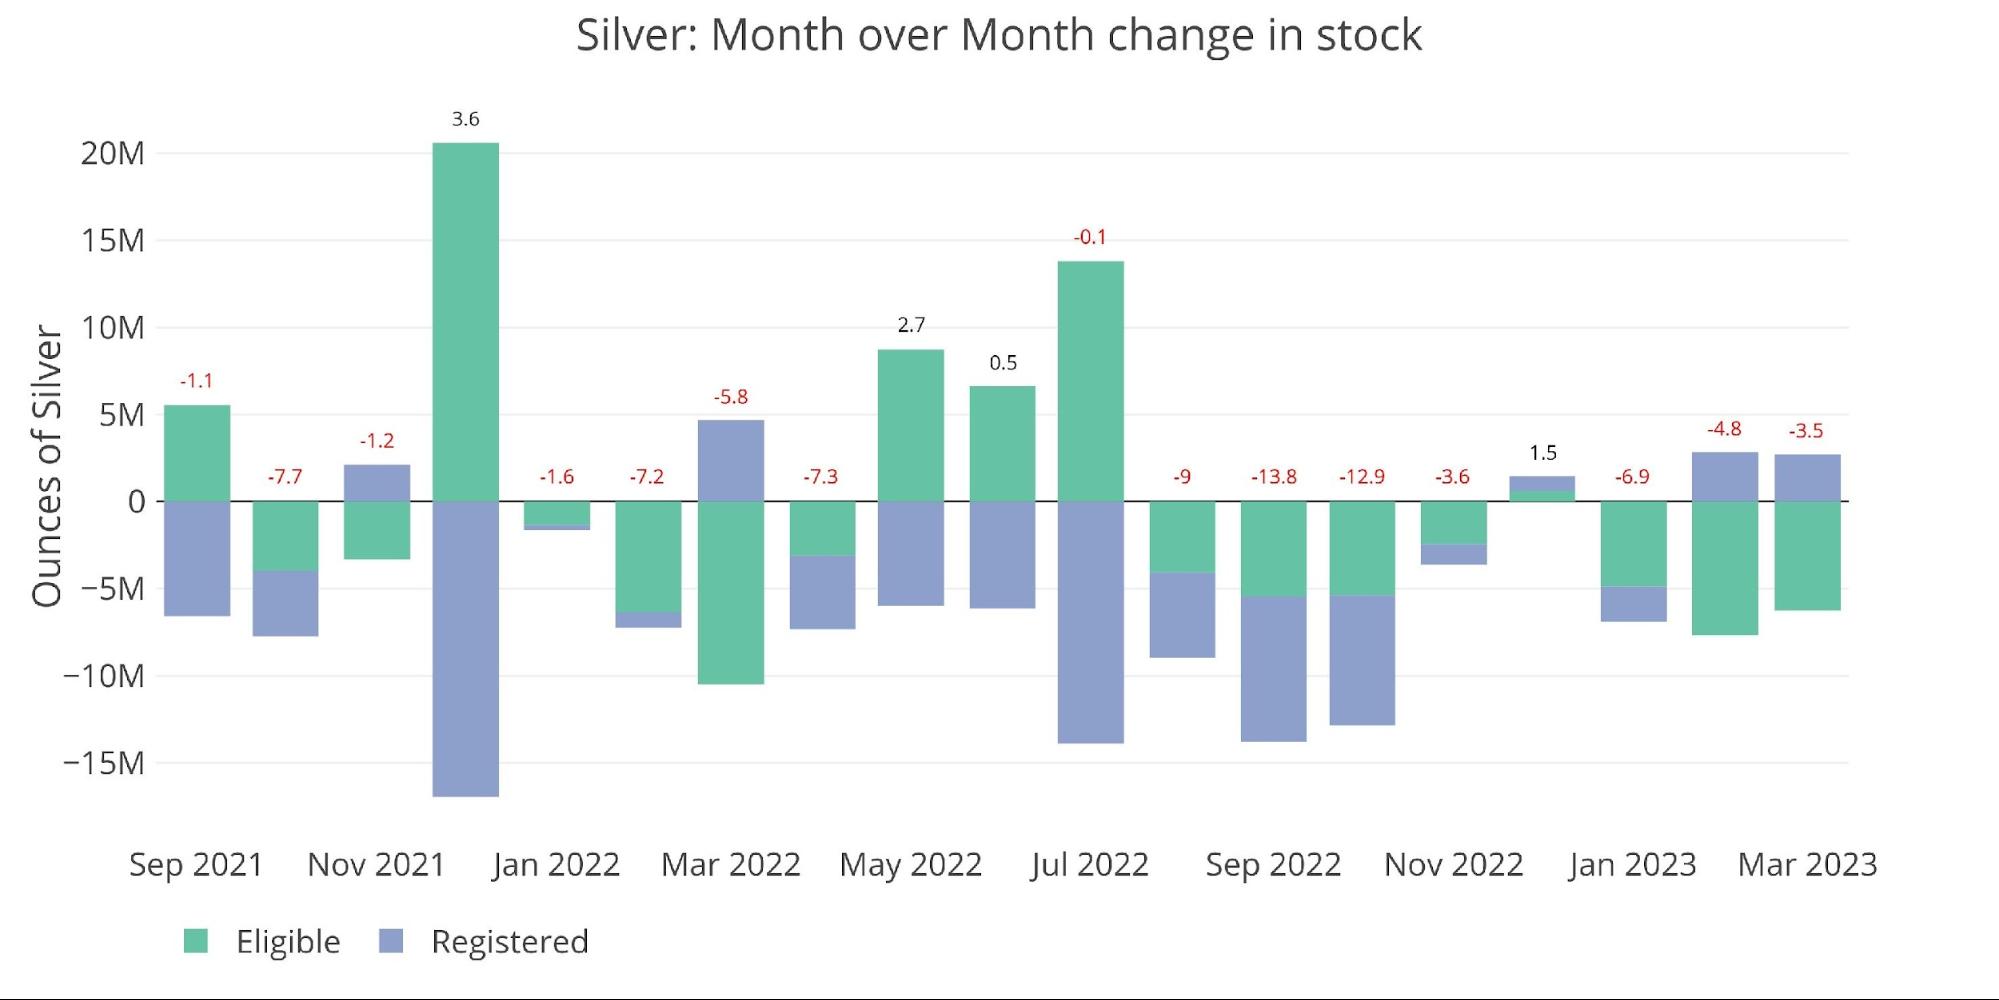
Figure: 4 Recent Monthly Stock Change
Unlike gold, the outflows slowed this week. The big moves into Registered occurred just as the March silver contract started its delivery. If Registered silver was not getting close to the bottom, why did the Comex have to move 7M ounces of silver into the Registered category to handle the March delivery volume? This metal was moved specifically to handle that demand which indicates available silver stocks are getting dangerously low.
Interestingly, the metal has not flowed back into Eligible as it typically does after delivery. The data shows that it was none other than JP Morgan taking the majority of the delivery at 5.2M ounces. Perhaps JP decided to obtain silver specifically for the purpose of keeping it in Registered to inflate the numbers. This move increased JP Morgan’s total allocation of Registered from 32% to 41.6%. This means almost half of all Registered silver now sits in JP Morgan vaults… most likely for optics.
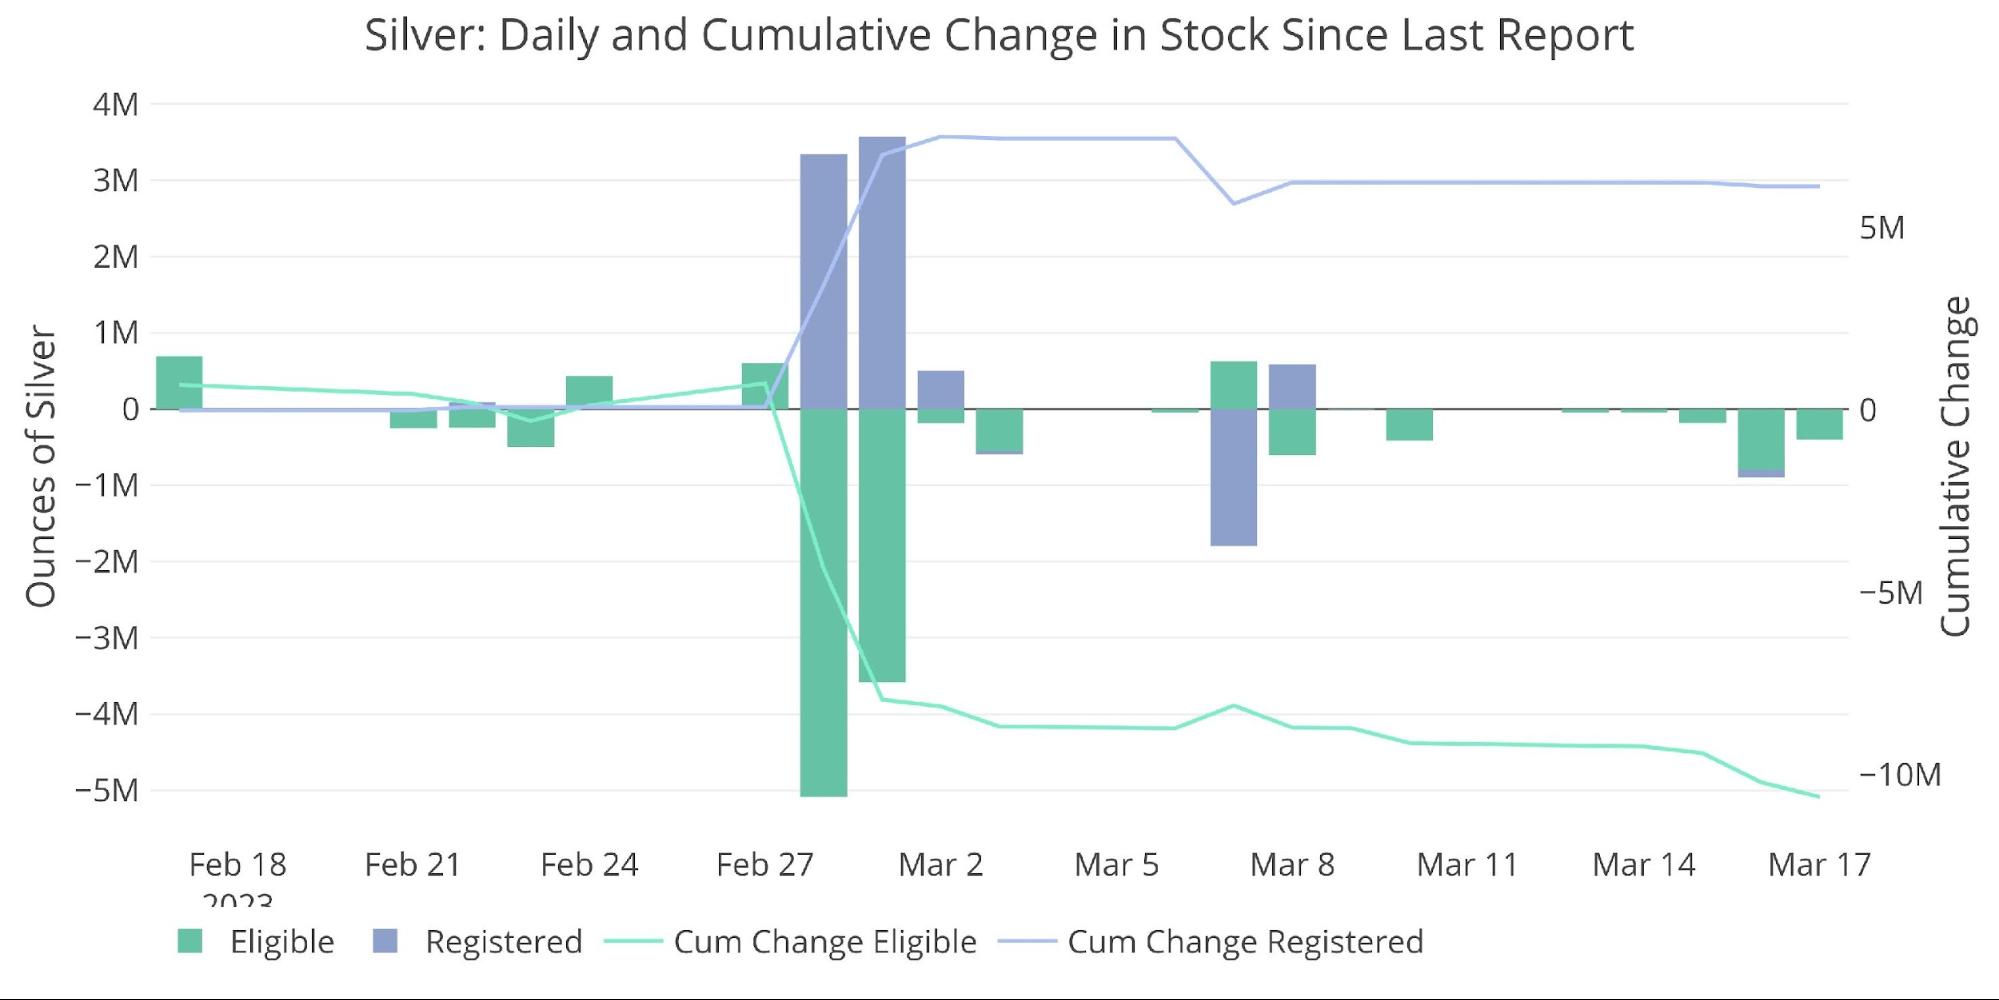
Figure: 5 Recent Monthly Stock Change
The table below summarizes the movement activity over several time periods to better demonstrate the magnitude of the current move.
Gold
-
- Over the last month, gold saw inventories fall by 2.1%
-
- Registered remains a bit higher than Eligible
-
- Since last year, total gold holdings have fallen by 36.8% or 12.4M ounces
- Over the last month, gold saw inventories fall by 2.1%
Silver
-
- Registered has increased 19.3% in the last month
- Total Registered remains below 40M ounces and has still seen a drop of 55M ounces in the last year
Palladium/Platinum
Palladium and platinum are much smaller markets but it’s possible that is where the market breaks first.
-
- Palladium saw a drop of 2.7% during its delivery month
- Platinum was very quiet during the month
Platinum is heading towards its next delivery month in April. In January, Platinum looked like it could break the Comex. At the time, we highlighted they had only bought a few months. Well, we are now close to where inventory will be put to the test once again.
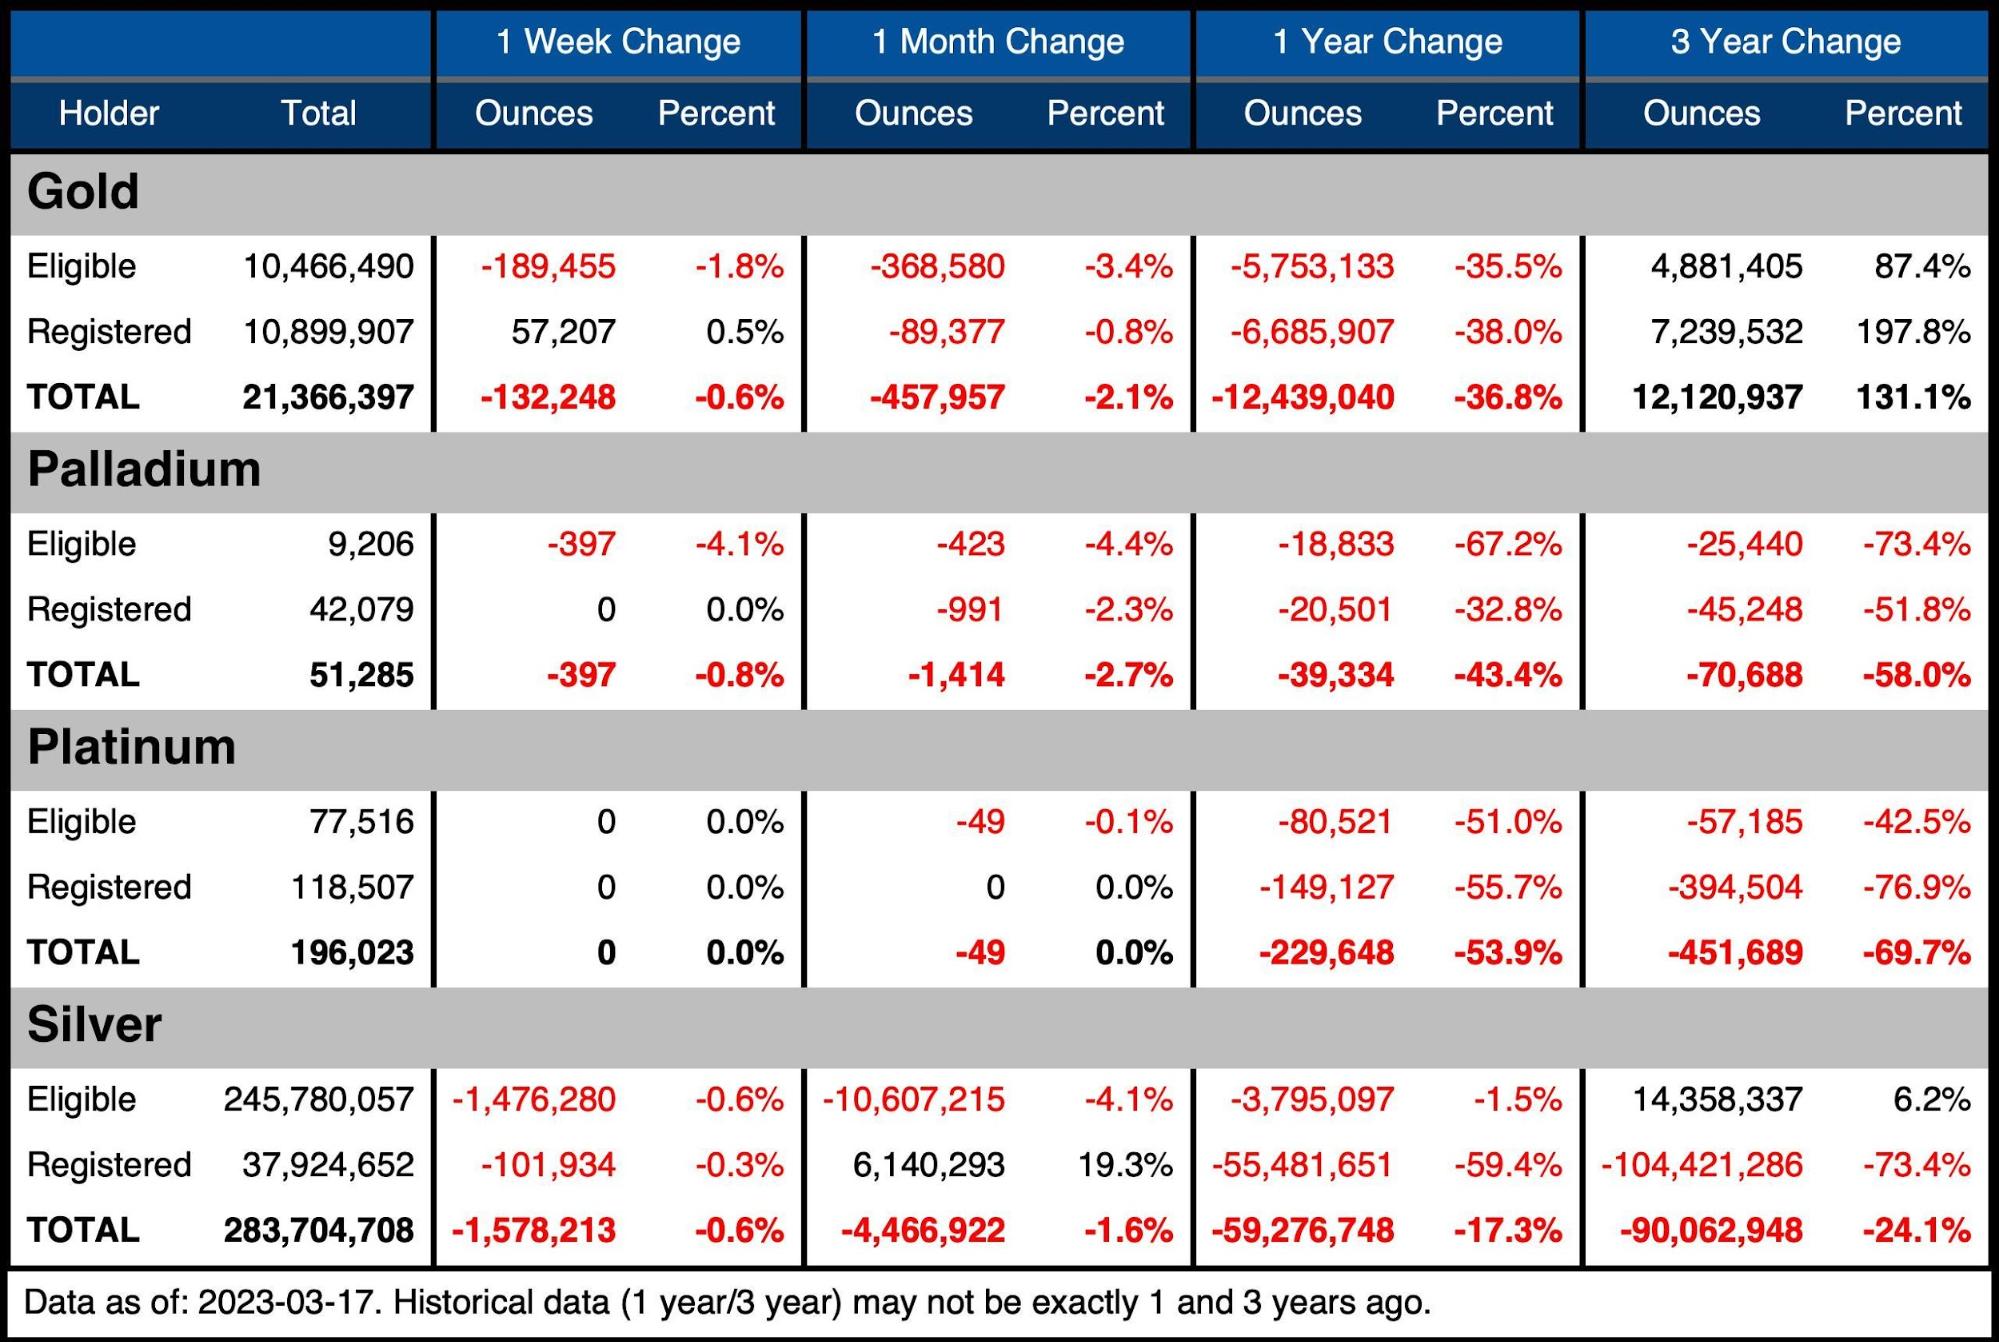
Figure: 6 Stock Change Summary
The next table shows the activity by bank/Holder. It details the numbers above to see the movement specific to vaults.
Gold
-
- 6 vaults lost gold over the month while none added
- Outflows were evenly distributed across all vaults
Silver
-
- JP Morgan only shows a net gain of 520k ounces, but as noted above, Registered inventories increased more than 5M ounces
-
- This indicates JP Morgan was moving the metal from within its own vaults
-
- CNT, HSBC, and Manfra all saw fairly large declines in their inventory
- JP Morgan only shows a net gain of 520k ounces, but as noted above, Registered inventories increased more than 5M ounces

Figure: 7 Stock Change Detail
Historical Perspective
Zooming out and looking at the inventory for gold and silver shows just how massive the current moves have been. The black line shows Registered as a percent of total.
Inventories in gold have been falling evenly in both categories, which is why the black line has stayed relatively flat even while supplies have been crashing. It’s amazing how closely the ratio has stayed to the 50% mark. In October, the ratio reached 45%, but quickly rebounded to 50%.
In September 2019, all of the Registered stood for delivery, so it is likely this ratio is now being actively maintained to make sure confidence persists in the system. Given current market dynamics, this confidence could be put to the test.
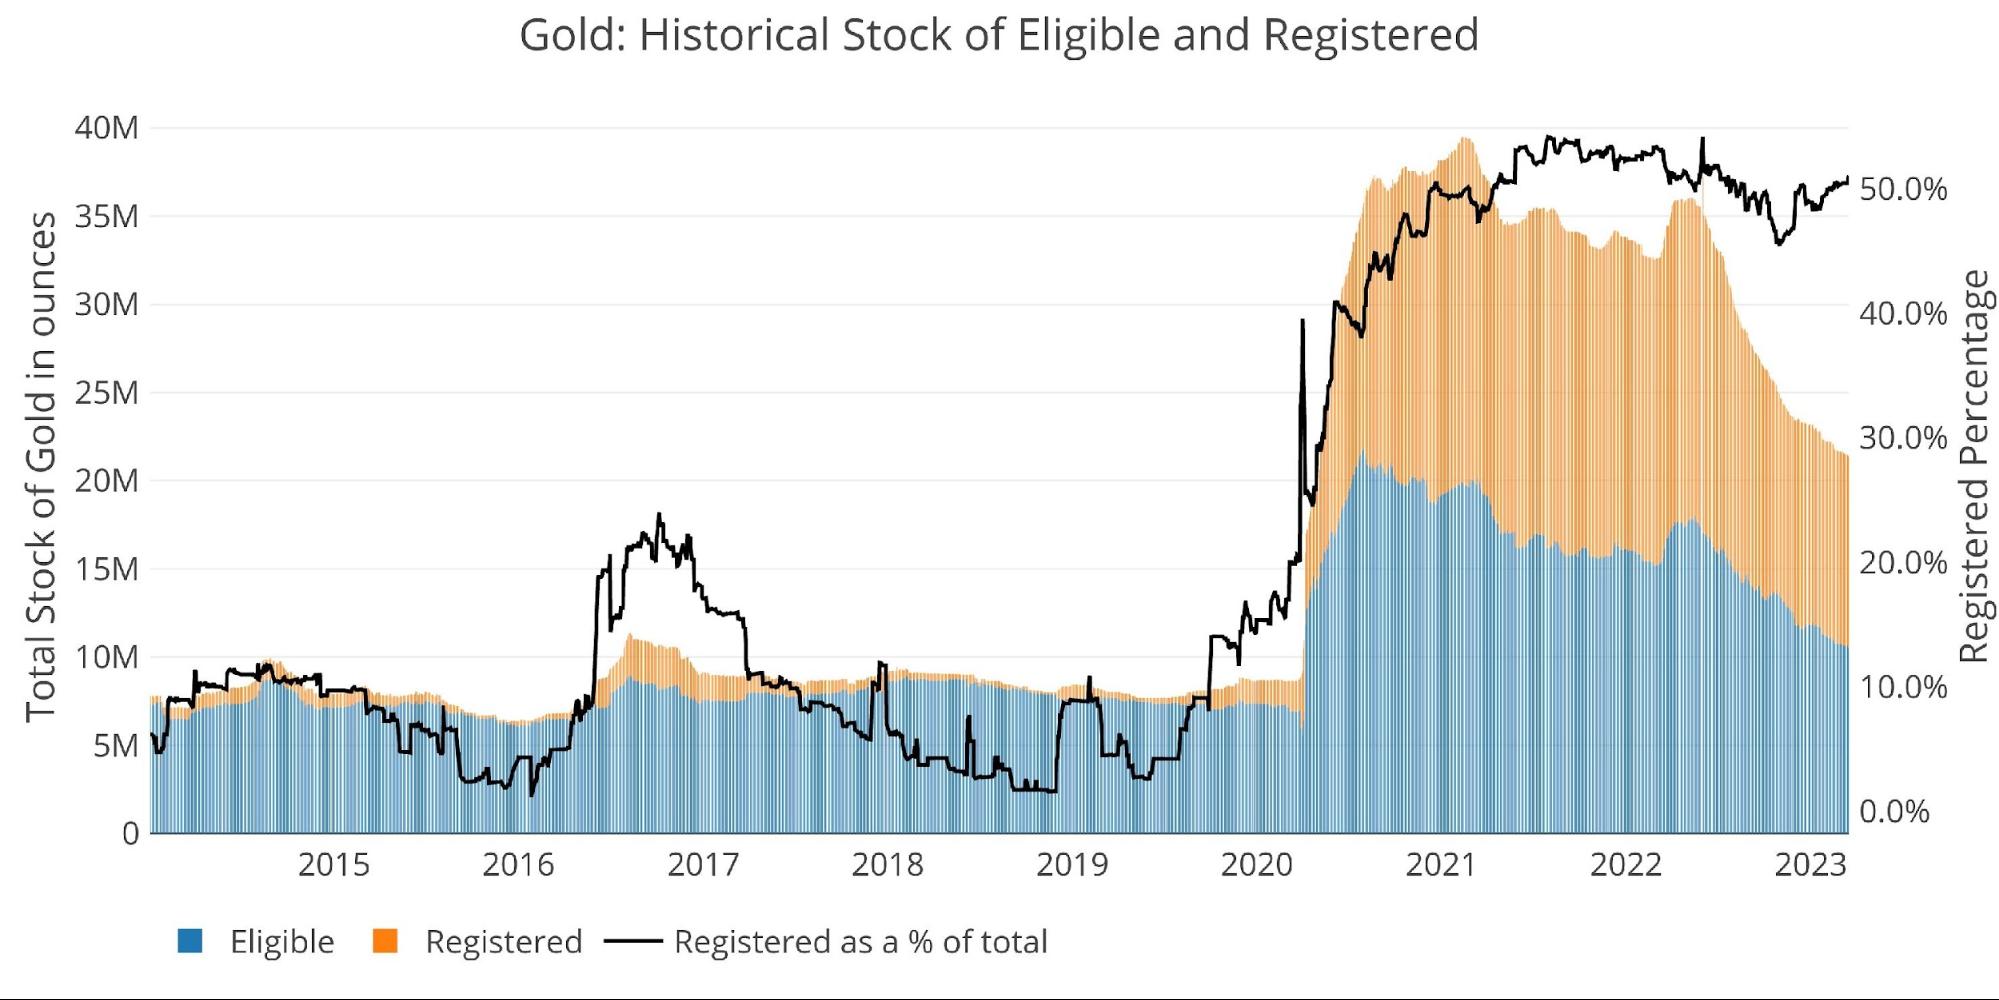
Figure: 8 Historical Eligible and Registered
Silver has seen far more concentrated outflows from Registered, getting as low as 10.9% of total inventory in February. With the move by JP Morgan, the ratio has since recovered to 13.3%, but this is still at historically low levels compared to history.
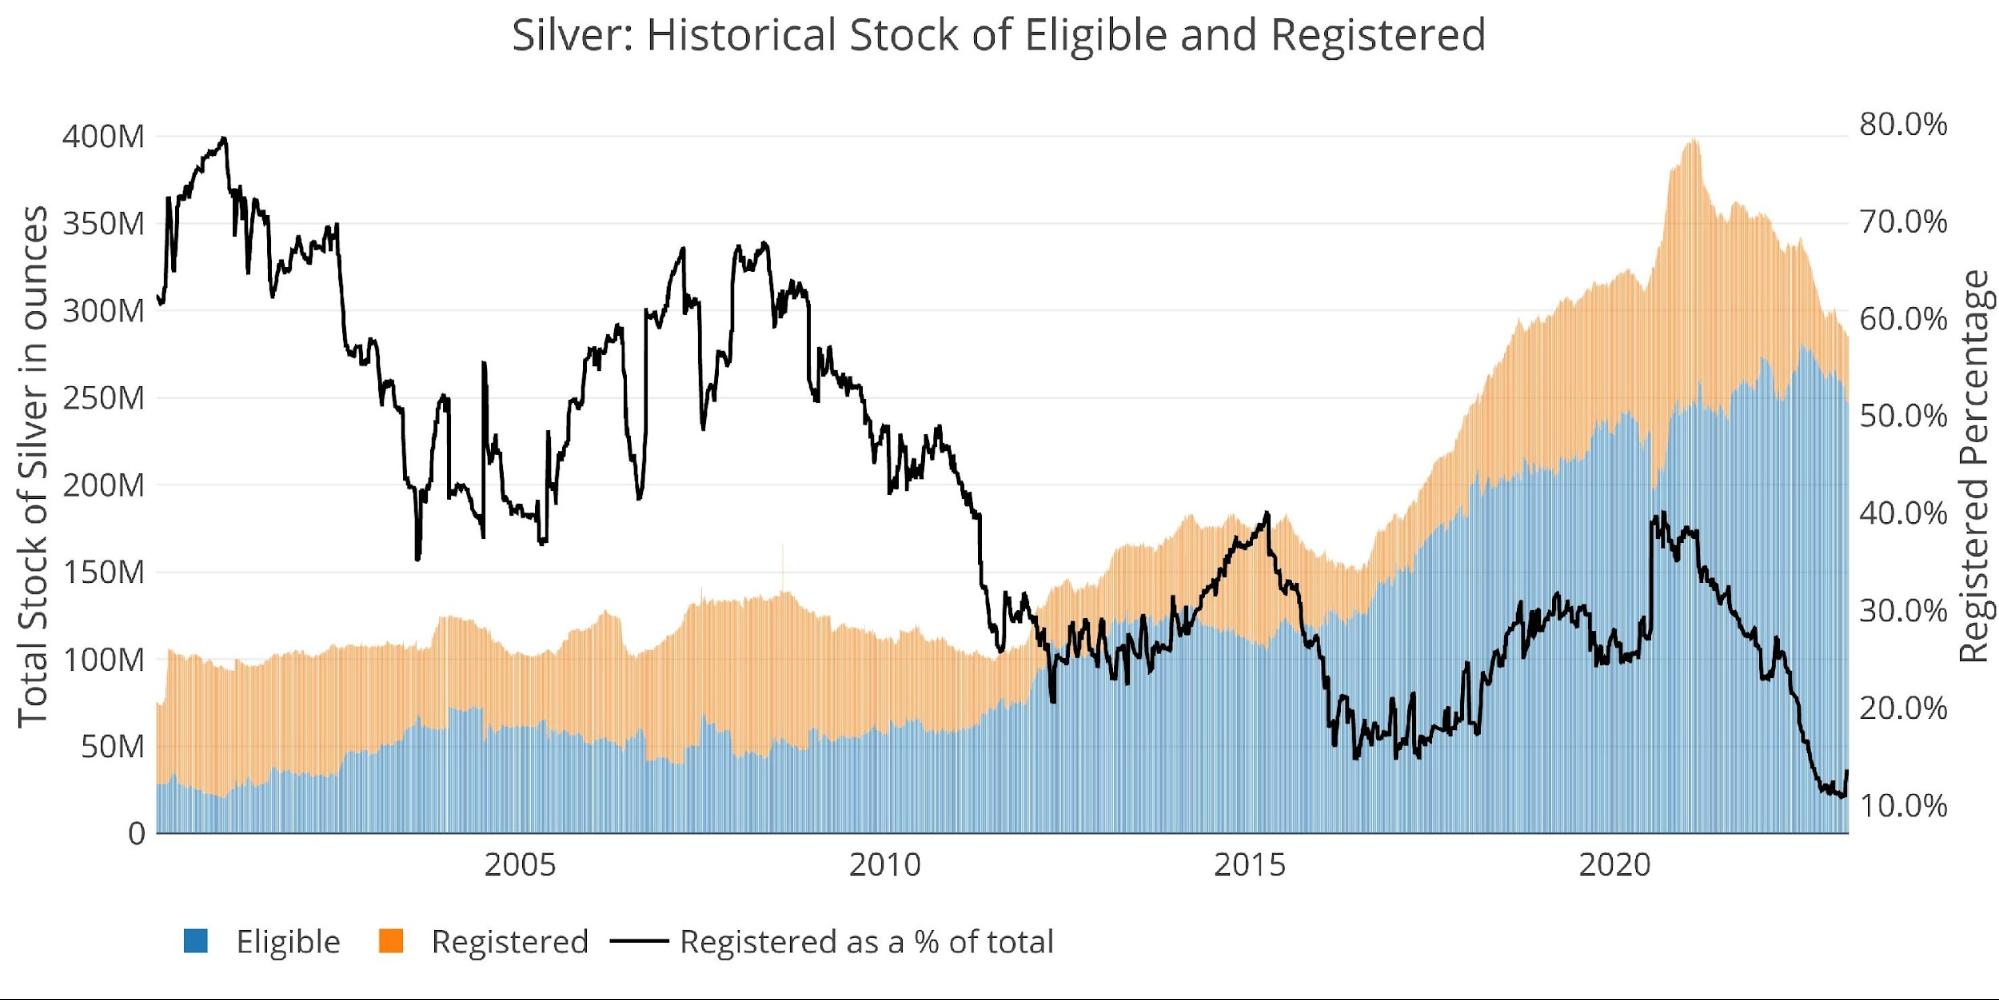
Figure: 9 Historical Eligible and Registered
The recent “spike” can be seen on the far right side of the chart above. From this perspective, the moves by JP Morgan seem much smaller. A similar spike-up happened in March 2022 which quickly reversed as metal started flowing back out of Registered immediately after. Will 2023 see a similar pattern?
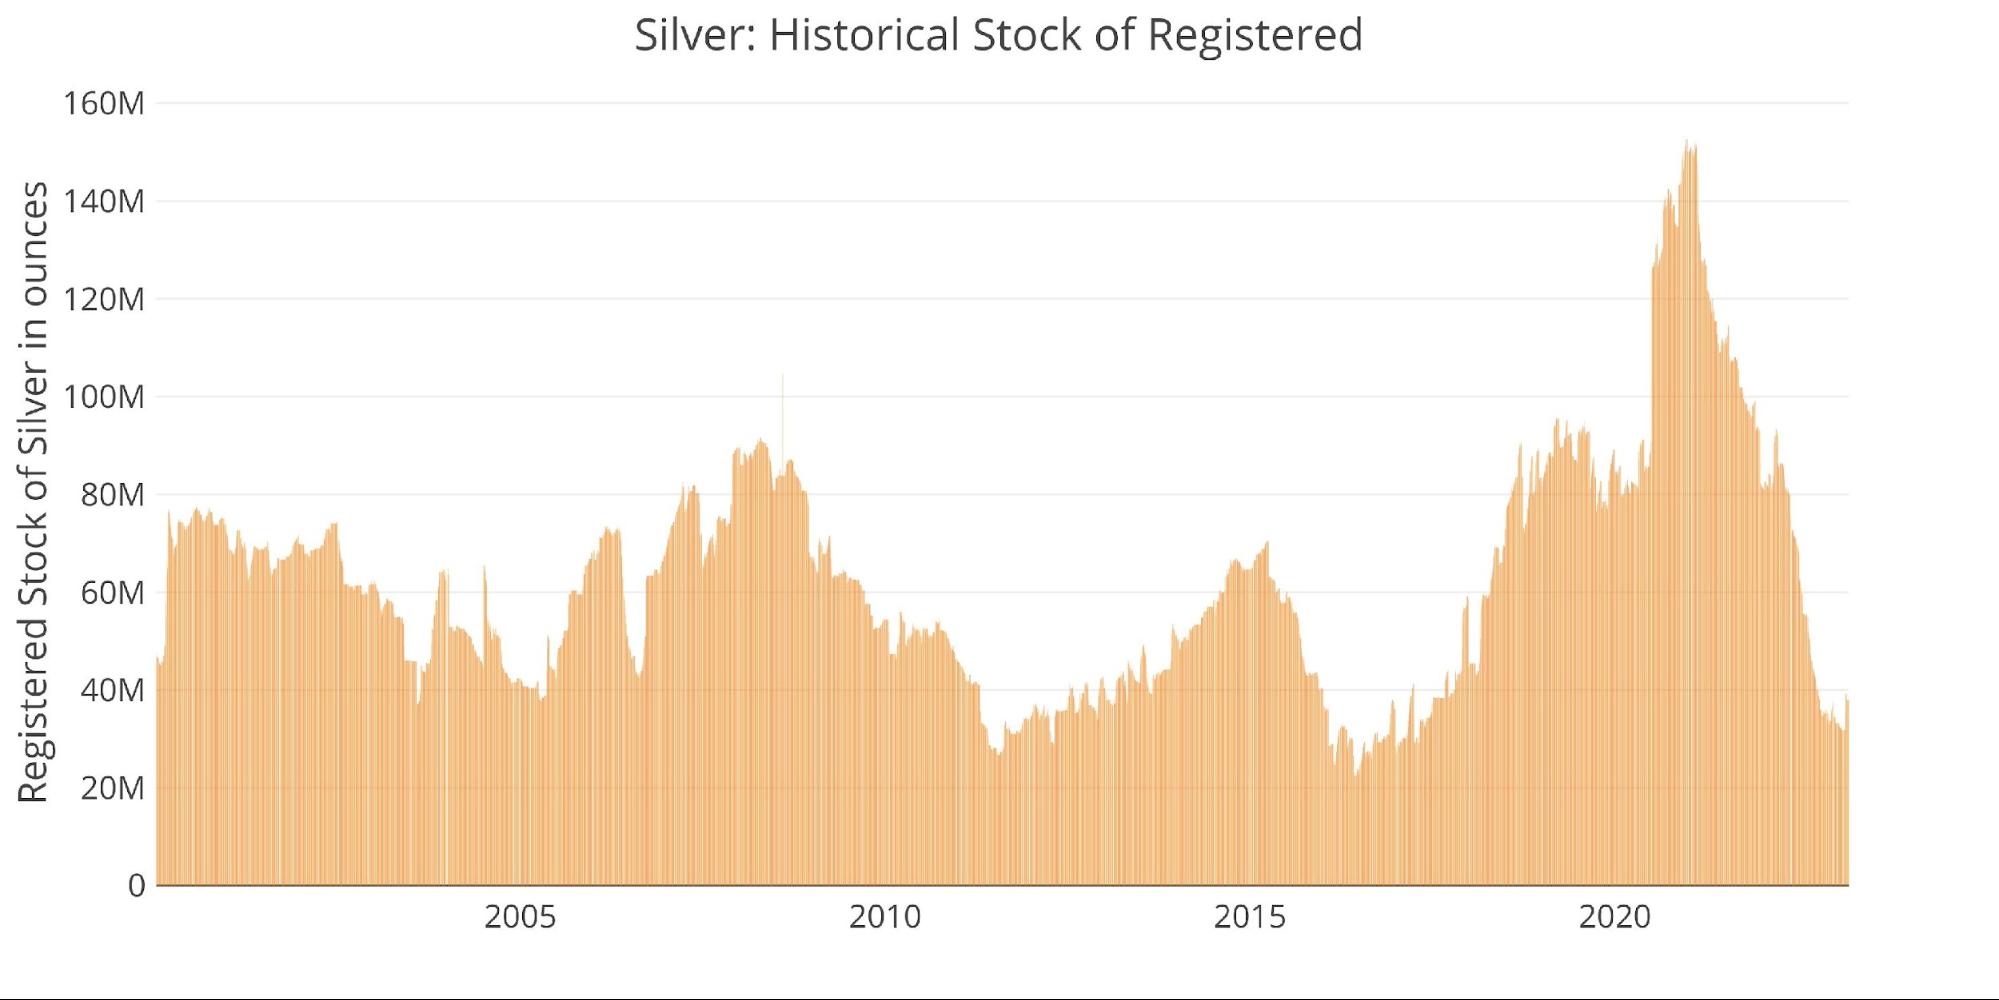
Figure: 10 Historical Registered
The LBMA had been seeing similar outflows of silver from their vault, but that appears to have stopped for now.
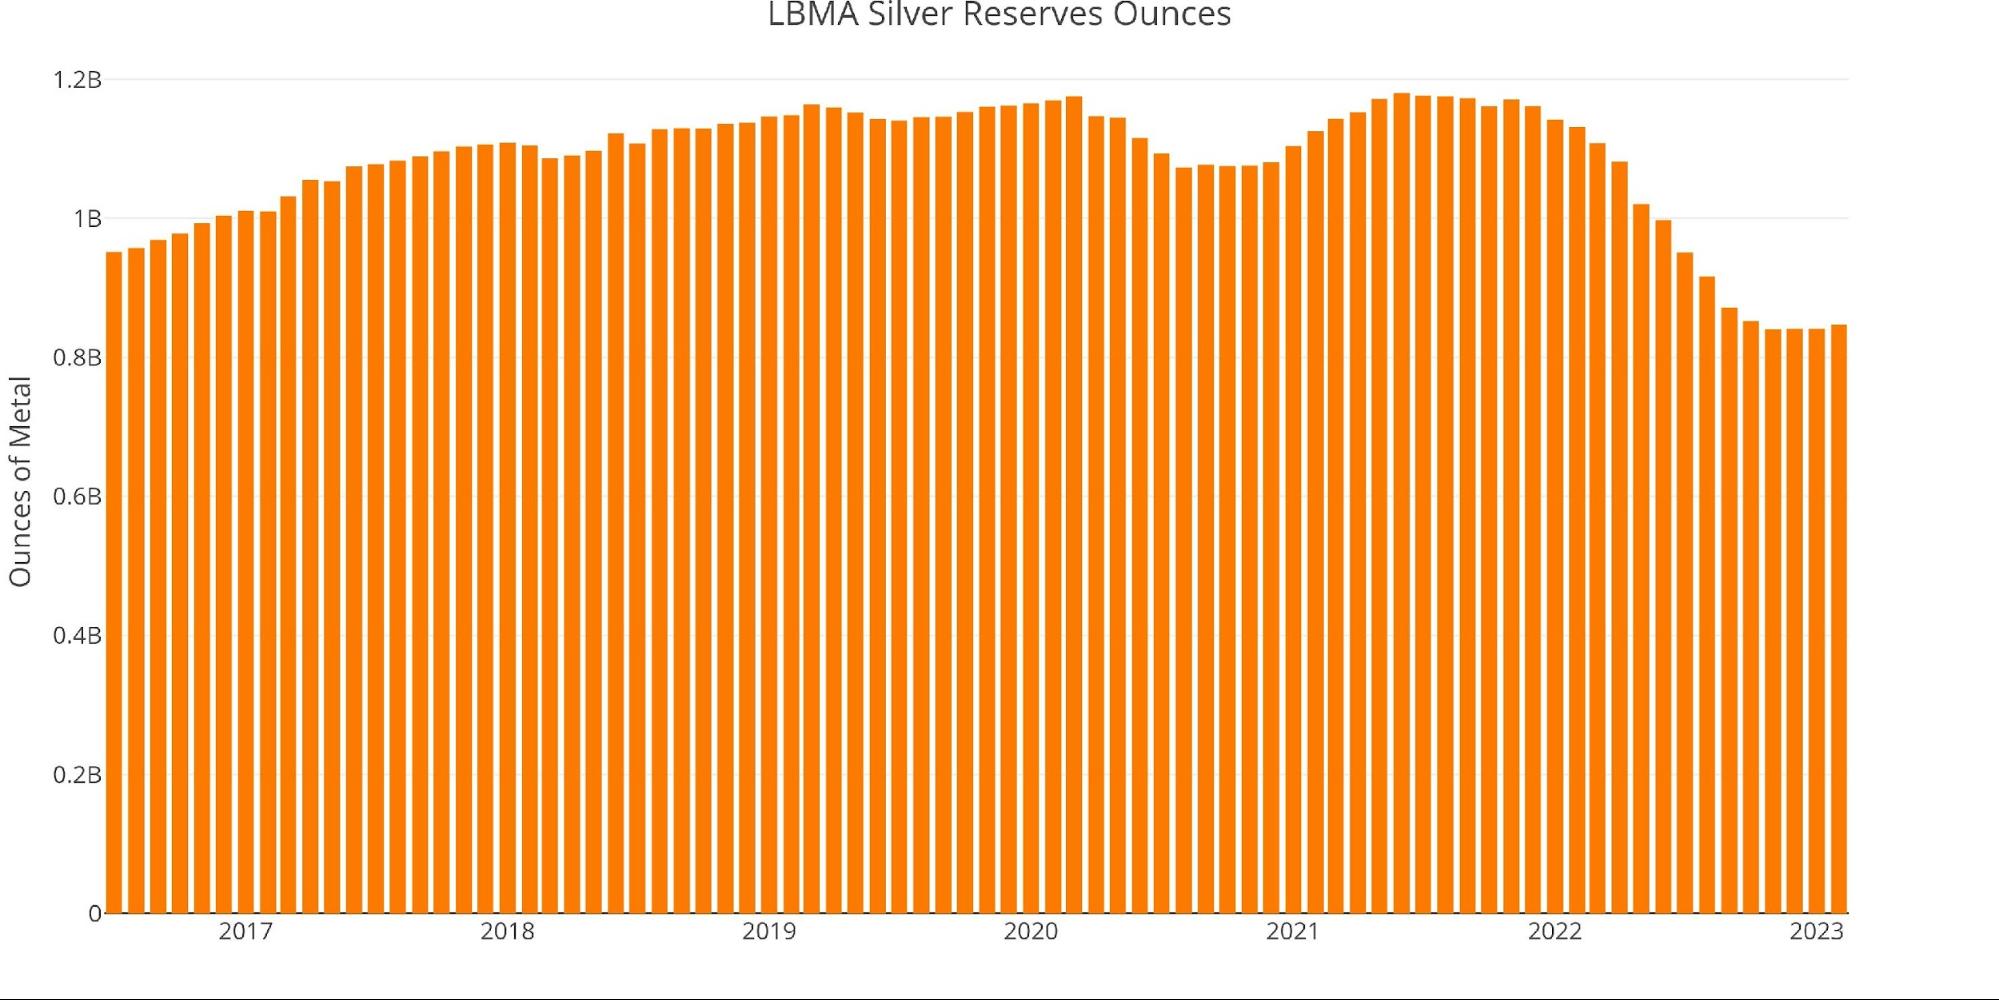
Figure: 11 LBMA Holdings of Silver
Available supply for potential demand
Coverage on the Comex continues to deteriorate. On Jan 26, before the recent sell-off in gold, the amount of paper gold for each Registered physical ounce was 4.6. That is the highest level since July 2020, right before all the new supply was added. The ratio now sits at 4.2, but the drop has mainly been driven by a fall in Open Interest rather than a surge in inventory.
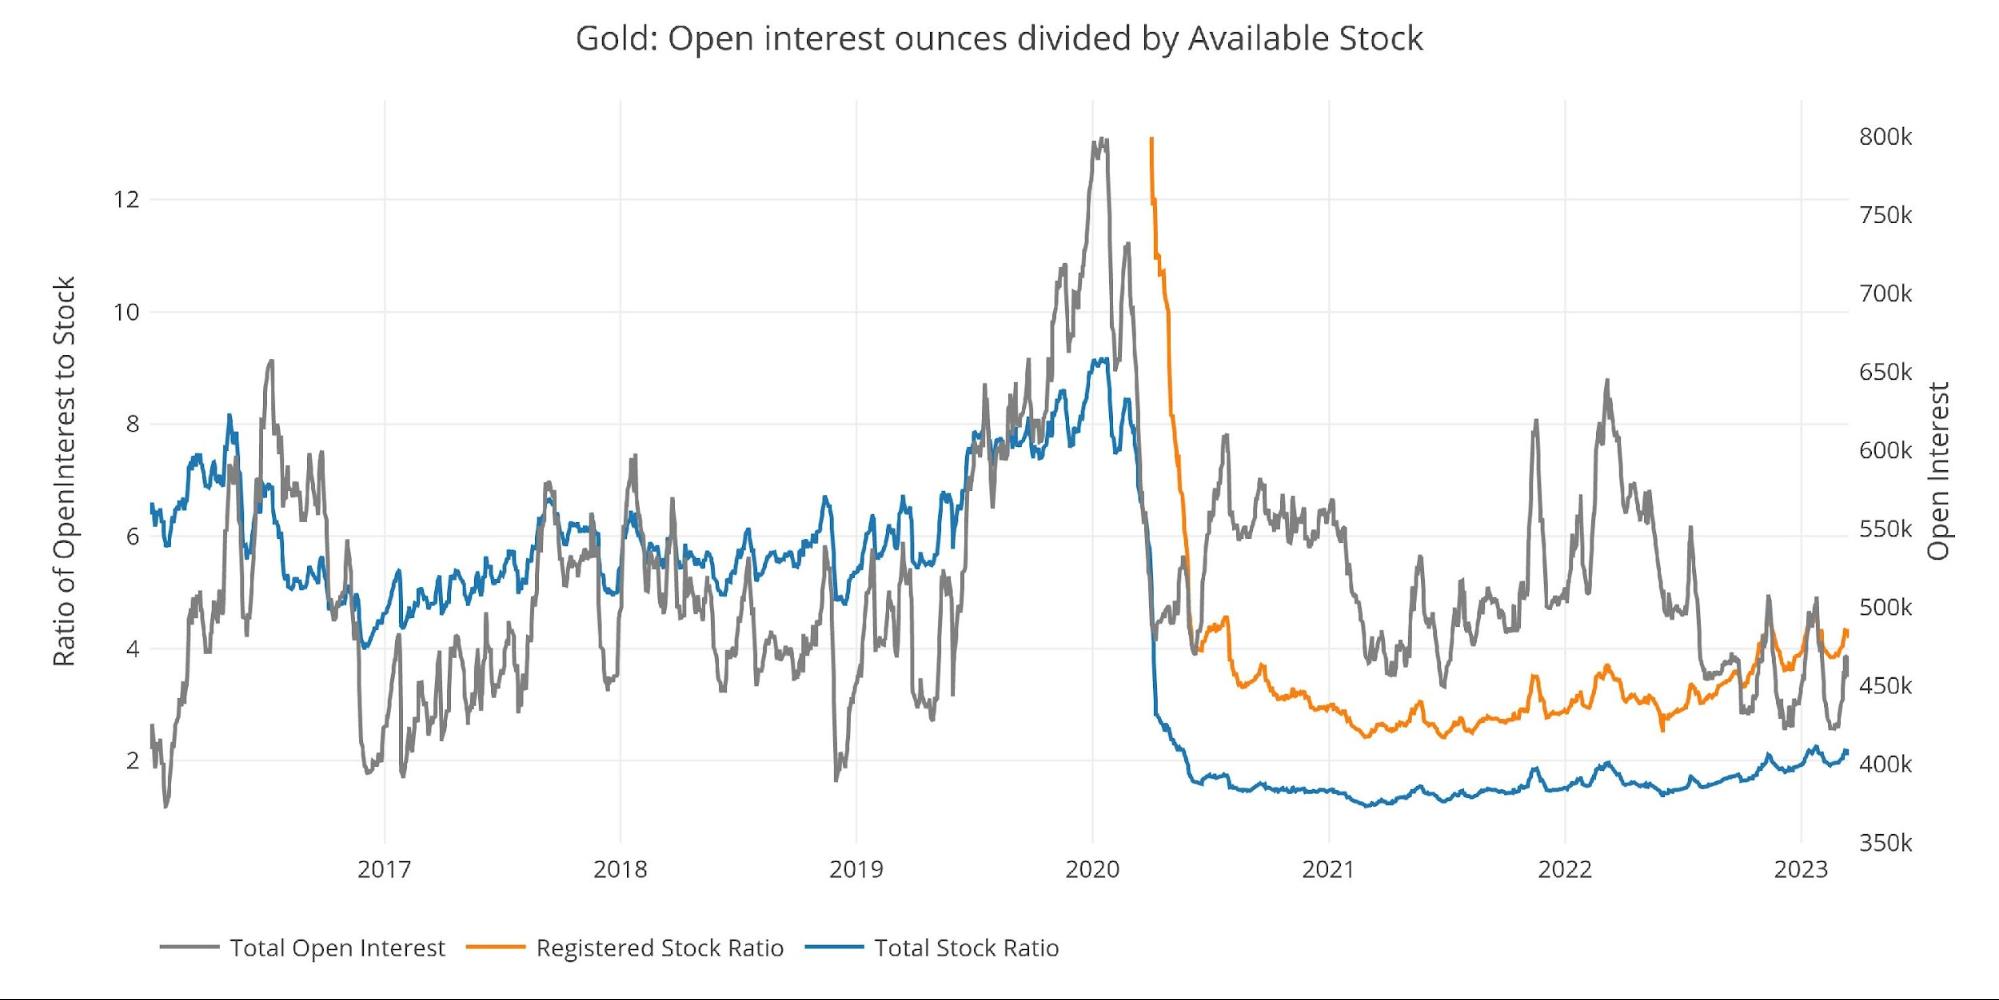
Figure: 12 Open Interest/Stock Ratio
Coverage in silver is far worse than gold. The paper to Registered physical ratio reached 22 ounces on Feb 2nd. It had drifted lower to 19.5 and then after JP Morgan stepped in, the ratio dropped to 15.4.
This means that after the move by JP Morgan, there are still 15 paper contracts for every physical ounce of metal available.

Figure: 13 Open Interest/Stock Ratio
More By This Author:
A Crack In The Dam
Chinese Gold Demand Continued To Surge In February
If It Looks Like A Bailout And Walks Like A Bailout It’s Probably A Bailout


