
Still Hiding? Nothing’s Changed, Get Out Of The Bear’s Den!
I could write a nice lengthy introduction today, but it seems that there’s only one question on your mind right now, so I’ll quickly address it instead. Has the outlook for gold, silver, and mining stocks become bullish because of yesterday’s rally? My answer is: no, it hasn’t changed.
Let’s jump to the charts.
Support the Dollar
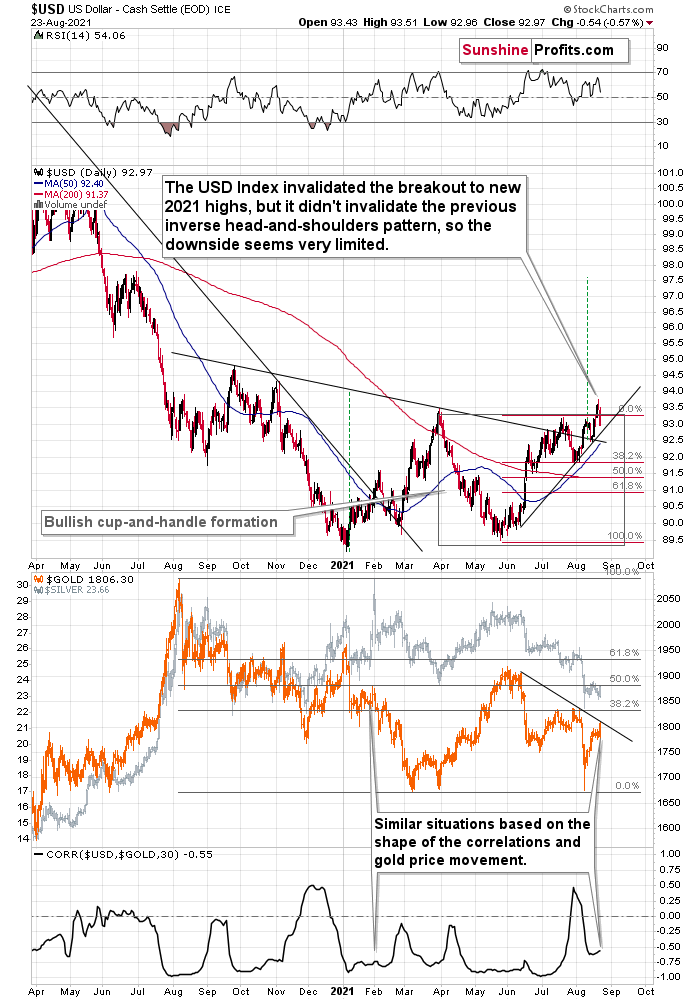
The USD Index invalidated the breakout to new 2021 highs, but it didn't invalidate the previous inverse head-and-shoulders pattern, so the downside seems very limited.
There’s a rising short-term support line based on the June and July lows that currently “says” that the USD Index is unlikely to fall below ~92.75. At the moment of writing these words, the USD Index is trading at about 93.07, so it’s very close to the above-mentioned level.
And even if the USDX declines below it, there’s support at about 92.5 provided by the neck level of the previously confirmed inverse head-and-shoulders pattern. This means that the USDX is unlikely to decline below this level, and this in turn means that the downside seems to be limited to about 0.6 index point. That’s not a lot.
Remember when the USD Index previously invalidated the breakout above the inverse H&S pattern? I wrote then that it could decline to the nearest support level provided – then – by the 38.2% Fibonacci retracement. Now the nearest support is provided by the rising support line at about 92.75.
This doesn’t mean that gold will necessarily rally from here or that the rally will be substantial. On the lower part of the above chart, you can see that gold moved to its declining resistance line, which means that it could decline right away. We can see it more clearly on the gold chart below.
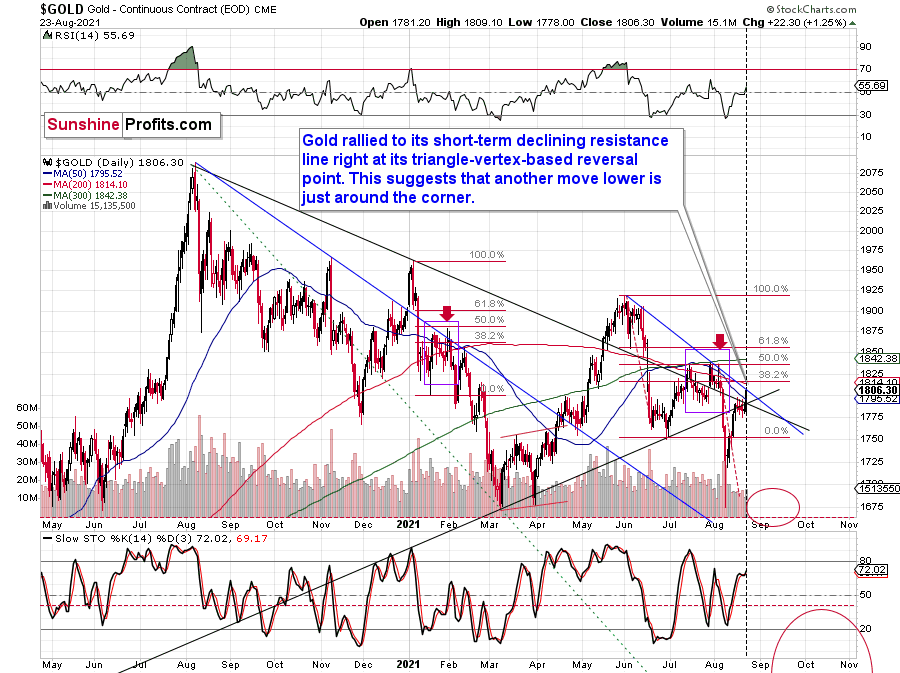
In this case, I marked the declining short-term resistance line with blue. The combination of the resistance line being reached with the fact that gold did that right on its reversal day indicated by the triangle’s vertex makes it even more likely that gold will reverse its course shortly.
We can see the same thing – gold moving to its resistance line – also when we look at its performance through its most popular proxy – the GLD ETF.
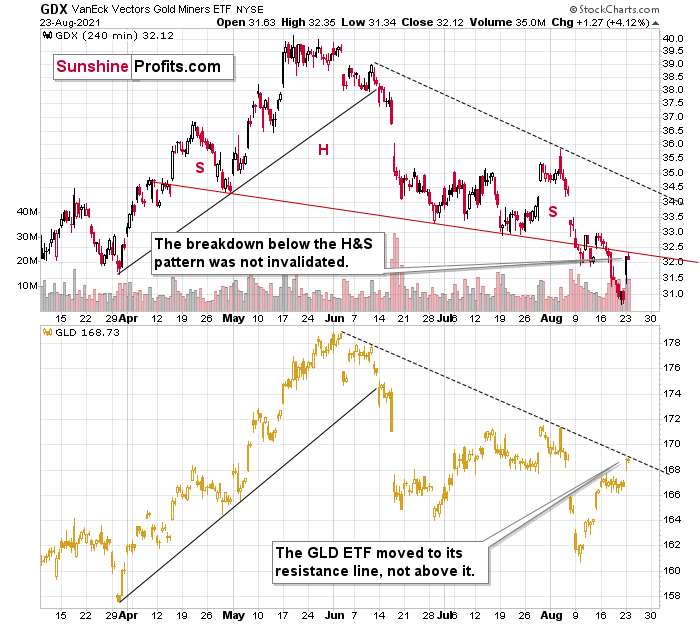
In this case, we can compare where gold rallied to where the mining stocks (the GDX ETF) rallied. And while the GLD moved to its declining resistance line, the GDX ETF was not even close to its analogous dashed declining resistance line.
Instead, the GDX ETF moved back to its previously broken neckline of the head and shoulders pattern and closed slightly below it.
This is more important than comparing the GDX’s closing price to its previous yearly low — it closed slightly above it.
The 2013 Analogue Still in Play
And speaking of mining stocks, the HUI Index closed slightly above its previous March lows (in terms of the closing prices), but it was just 0.24 index point rally above it.
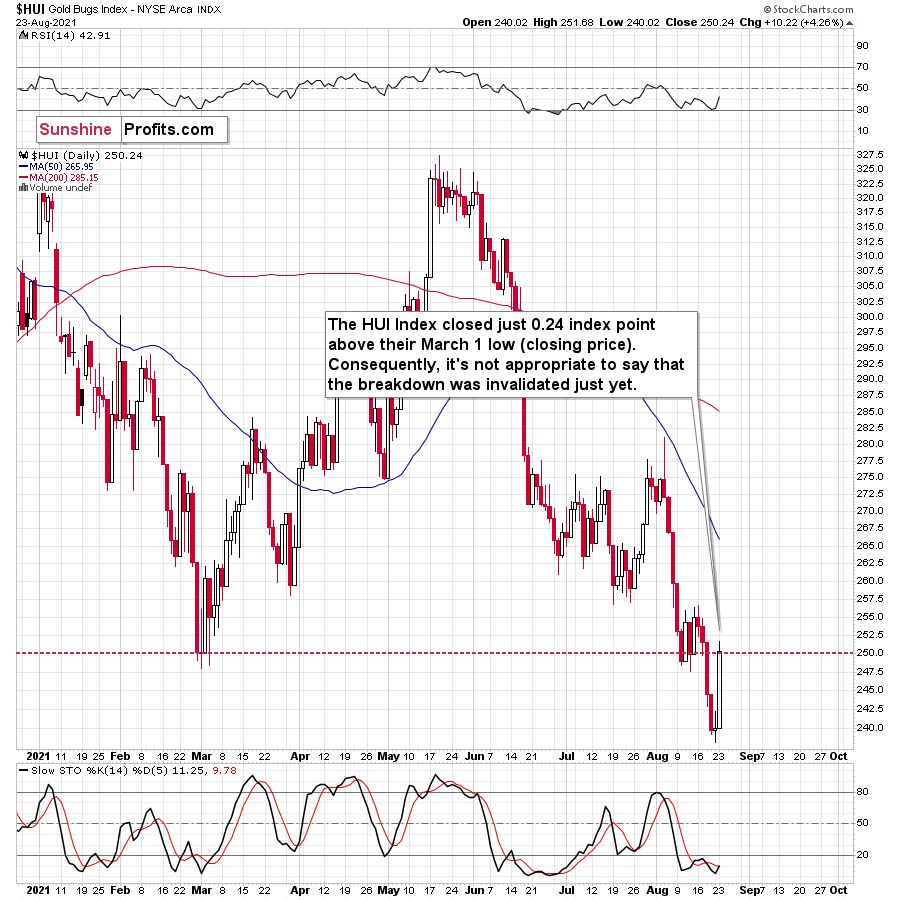
Consequently, it’s not appropriate to say that the breakdown was truly invalidated. It’s kind of a “gray area” of invalidations. That’s not the most important point of view though.
The most important point of view is the broad point of view.
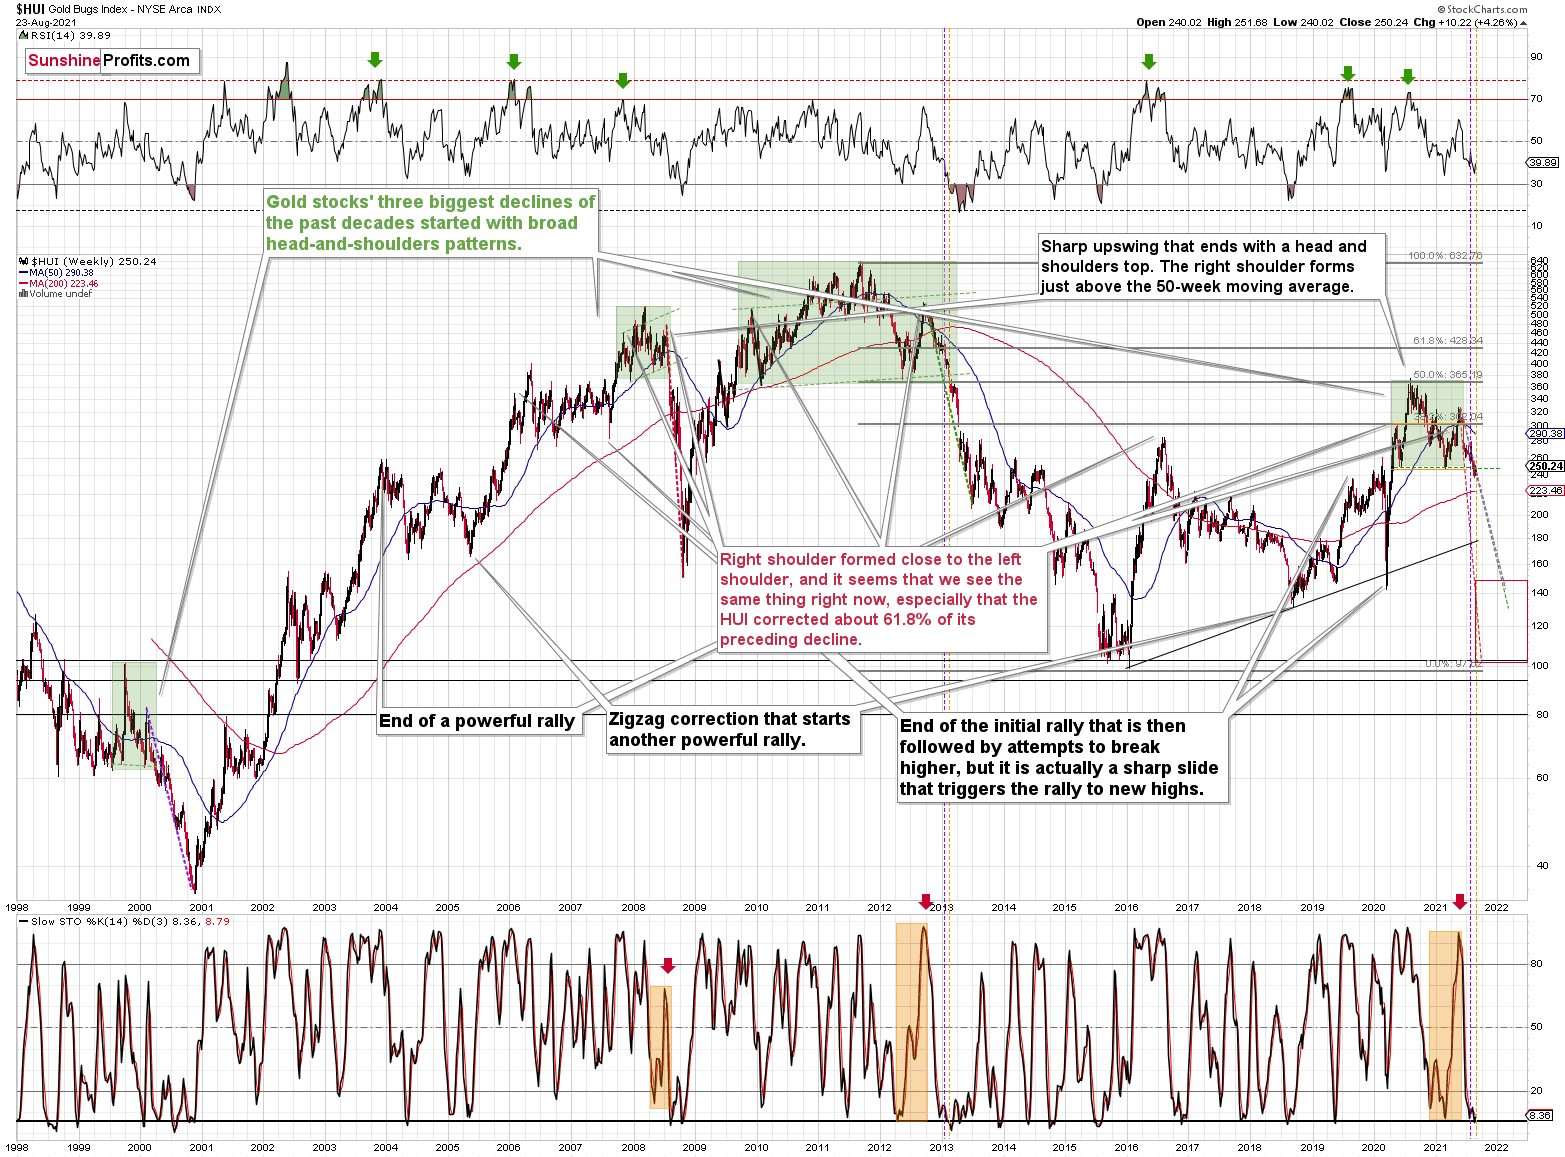
Do you see any change with regard to the similarity between now and what happened in 2013? No? Because nothing changed with regard to it.
It’s useful to keep in mind that the current post-broad-head-and-shoulders pattern is not only similar to what happened in 2013 but also to what happened in 2008 and… in 2000. In the case of the former, there were ~4%-8% corrective upswings after the breakdown below the H&S pattern. In the case of the 2008 slide, there was no short-term correction, and in the case of the 2000 decline, there was even a corrective upswing that pretended (!!!) to invalidate the head and shoulders pattern, after which the HUI Index declined about half of its value.
Gold stocks moved higher about 4% so far this week. This is in perfect tune with what happened in 2013 and in 2000.
In fact, let’s check what exactly happened in 2013 in the GDX ETF.
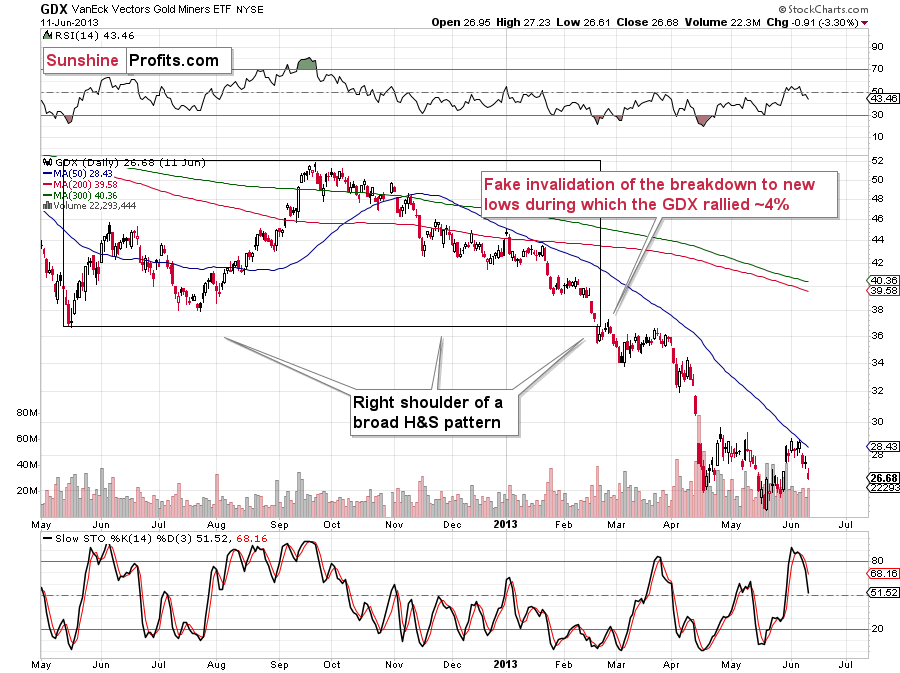
Right after breaking below the previous lows, there was a ~4% rally that took the GDX ETF above the previous low in terms of the closing price, but only slightly so. Seems familiar?
Yes, that’s exactly what happened yesterday.
If the analogy to 2013 is being repeated almost to the letter, should this performance be really treated as something bullish? No.
Disclaimer: All essays, research and information found on the Website represent the analyses and opinions of Mr. Radomski and Sunshine Profits' associates only. As such, it may prove wrong ...
more

