
Silver’s Surge: XAGUSD Reacts Strongly From Blue Box Area

Image Source: Pixabay
In this technical blog, we will look at the past performance of the Daily Elliott Wave Charts of the XAGUSD. The rally from the August 2022 low showed a higher high sequence & provided a swing buying opportunity at the blue box area. In this case, the pullback managed to reach the blue box area & provided a perfect reaction higher. So, we advised members not to sell Silver but to buy the blue box area for a minimum reaction higher to happen. We will explain the structure & forecast below:
XAGUSD Daily Elliott Wave Chart From 4.05.2025
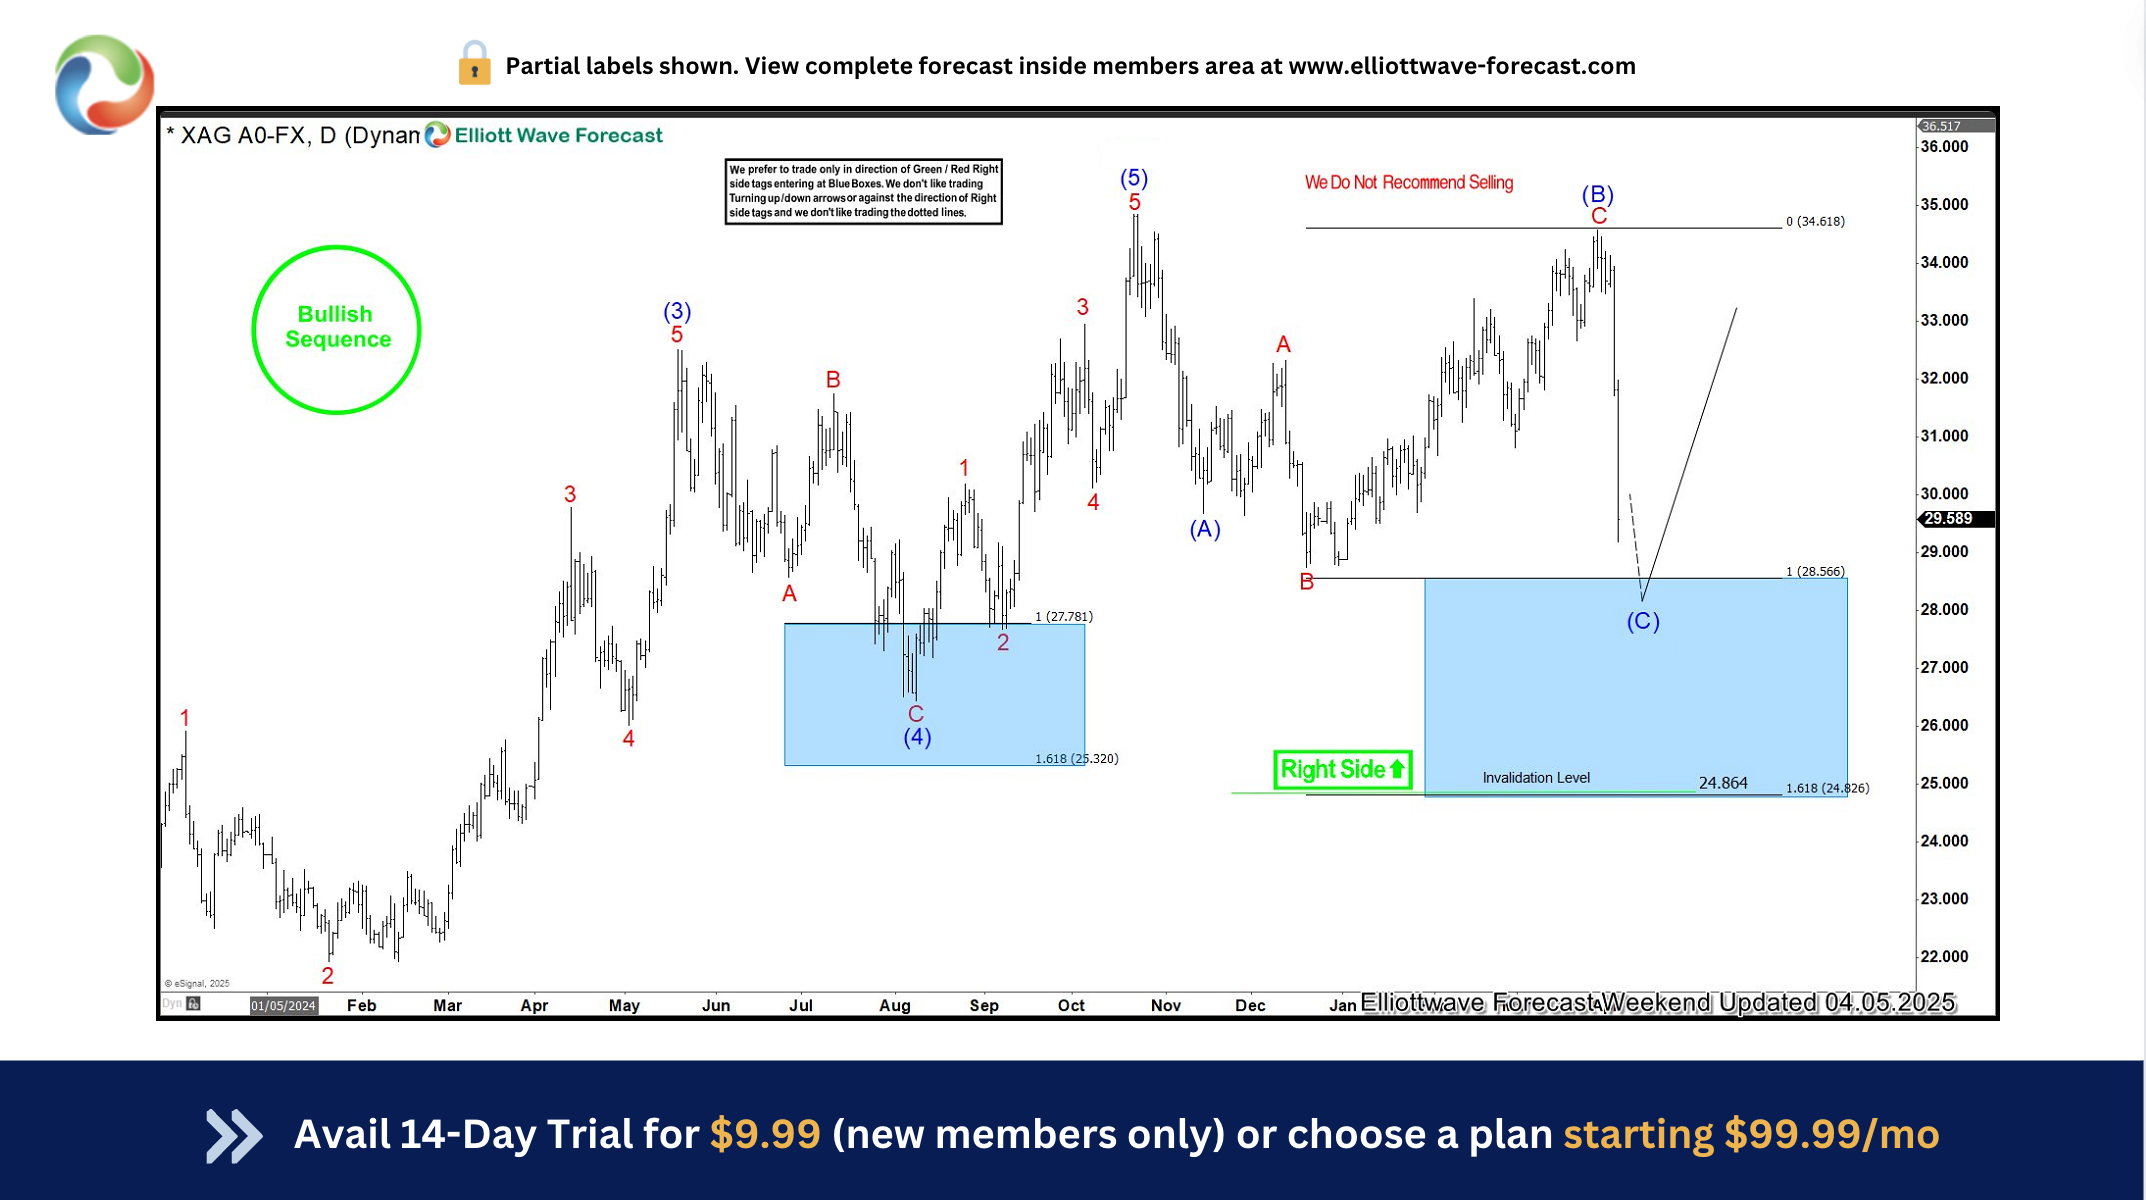
Here’s the Daily Elliott wave Chart from the 4.05.2025 Weekend update. In which, the rally to $34.86 high ended the cycle from March 2023 low & made a pullback against that cycle. The internals of that pullback unfolded as Elliott wave zigzag structure where wave (A) ended at $29.68 low. Then a bounce to $34.58 high-ended wave (B) & started the next leg lower in wave (C) towards $28.56- $24.82 equal legs area. From there, buyers were expected to appear looking for new highs ideally or for a 3-wave bounce minimum.
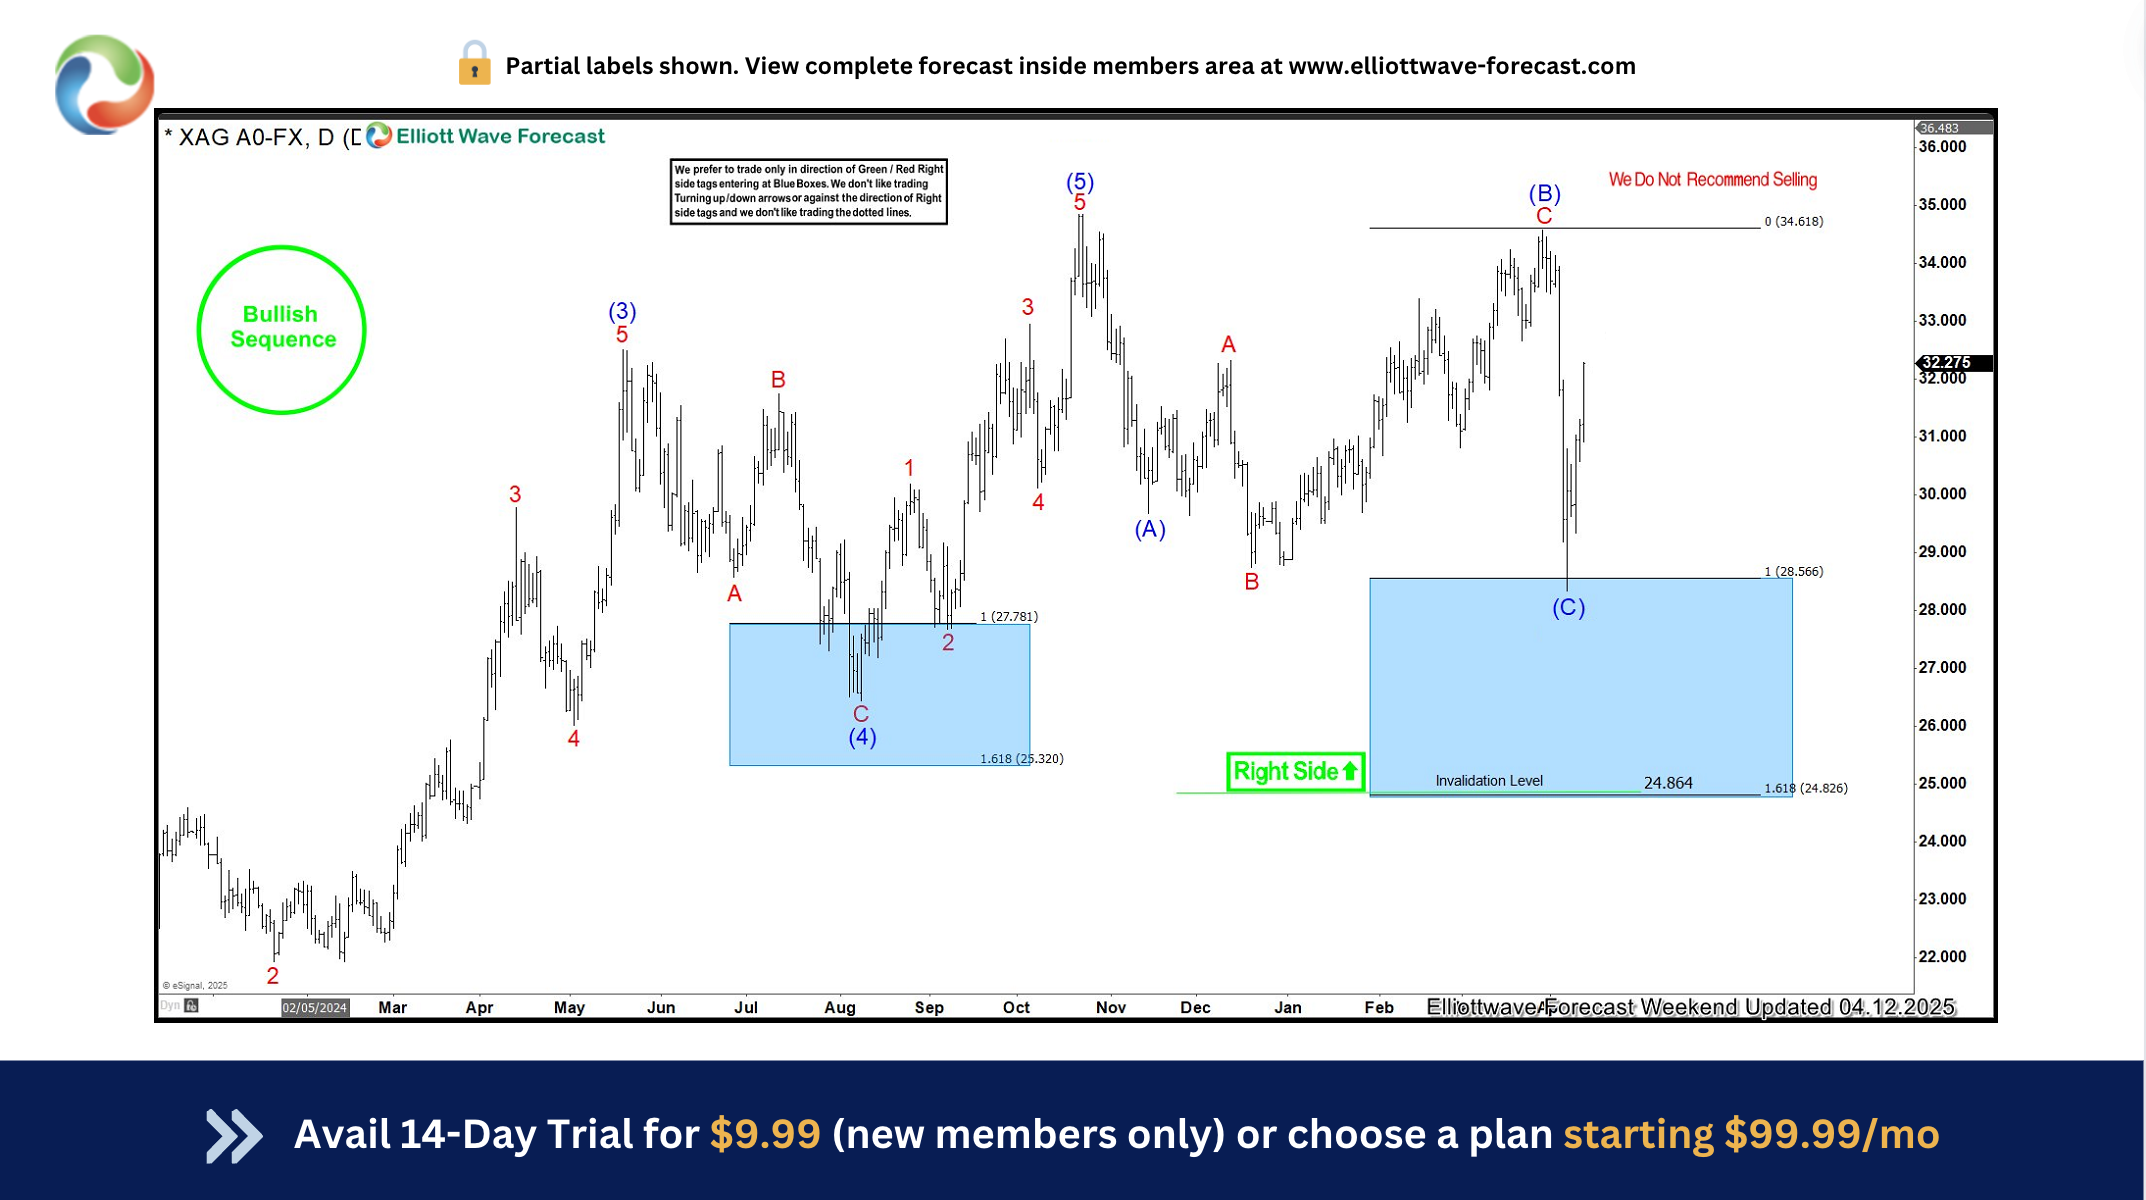
XAGUSD Latest Daily Elliott Wave Chart From 4.12.2025
More By This Author:
Nvidia Stock: Elliott Wave Irregular Flat Pattern AnalysisNavigating The EURUSD Landscape: A Detailed Analysis Of Recent Movements
Strong U.S. Economic Data Dramatically Reduces Chances Of Fed Rate Cuts
Disclaimer: Futures, options, stocks, ETFs and over the counter foreign exchange products may involve substantial risk and may not be suitable for all investors. Leverage can work against ...
more

