
Silver’s Near-Parabola

Image Source: Pixabay
Silver has just rocketed up into a spectacular near-parabola! Such amazing performance has naturally captivated traders, who are aggressively buying as herd greed soars. Silver’s recent vertical surge is sure impressive technically, dominating charts. Yet surprisingly on both the overboughtness and futures fronts, these record silver levels haven’t been as extreme as you’d think given its recent big-and-fast gains.
A lifetime ago into January 1980, silver skyrocketed in a true parabolic moonshot to a record $48.00 per ounce. Those gains defied belief, as silver’s terminal one-month and two-month returns ran 103.8% and 196.1%!Borrowing from Crocodile Dundee, that’s a parabola. I’d define those as doublings within two-to-three months following massive bull runs. Both gold and bitcoin have also experienced such parabolas.
Also way back into January 1980, gold skyrocketed 127.9% in just 2.6 months. Bitcoin dwarfed that in 3.1 months into December 2017, launching a stratospheric 505.8% higher!There are plenty more historical market examples of parabolic ascents. Heck the entire NASDAQ soared 87.8% in a parabola-adjacent 4.7 months into March 2000! In contrast today’s silver surge is “merely” running 59.7% over the last 3.0 months.
So while it looks vertical on charts, it hasn’t achieved true parabola status. Hence this essay’s qualifying title. Silver’s massive outperformance is actually quite new. Most of the time historically, silver tends to act like a gold sentiment gauge. Upside momentum in the yellow metal spawns sympathetic buying in the white one. And because silver’s market capitalization is far smaller than gold’s, silver amplifies gold’s gains.
Midweek the world’s top-four assets by market capitalization are gold at $30.3t, NVIDIA at $4.3t, Apple at $4.0t, and silver at $3.7t. Bitcoin ranks 8th at $1.8t, behind Alphabet, Microsoft, and Amazon. While the precious metals’ market caps are estimates since no one knows exactly how much have been mined in the history of the world, their ratios should be about right. The global silver market is less than 1/8th gold’s size!
From early October 2023 to late July 2025, silver soared 87.3% higher in sympathy with gold’s monster bull. Yet silver’s performance was poor, merely pacing gold’s 86.2% gains in that span with no leverage. Silver’s fortunes started improving after that, surging another 37.5% in just 2.8 months into mid-October. Yet that was still just 1.4x gold’s parallel 27.4% gain then, well under silver’s 2x+ precedent during big gold moves.
A case in point happened during gold’s previous monster bull in mid-2020 out of the COVID-lockdown stock panic. Silver rocketed 142.8% from mid-March to early August that year, amplifying gold’s 36.5% upside in that span by a huge 3.9x! Based on a half-century-plus of historic silver-gold precedent, it’s hard to get excited about the white metal before 2x. Recently silver has accelerated hard towards that threshold.
Amazingly silver has soared another 42.2% from late October to midweek, leveraging gold’s simultaneous 8.8% rally by a fantastic 4.8x! That has boosted silver’s entire bull gains since late 2023 to 217.1%, 1.6x better than gold’s over that same span. Adding to recent excitement, silver has forged 15 new all-time-record nominal closes since early October. Yet inflation-adjusted real silver remains far under January 1980’s peak.
Using the US CPI inflation gauge which has chronically understated price increases for decades, $48 way back then is equivalent to $200 per ounce today!So in real terms $66 silver midweek is far from extreme. But don’t read too much into that, as January 1980 was an exceedingly-rare popular speculative mania. Even in nominal terms, that $48 close wasn’t bested until a whopping 31.3 years later in late April 2011.
Astoundingly the $48.43 peak that month was the single only day between mid-January 1980 to early October 2025 where silver exceeded that initial blowoff top!So essentially silver’s recent record streak started at a 45.7-year high on the way to a dozen-plus all-time ones. That April 2011 topping is relevant to today’s near-parabola. Silver’s terminal one-, two-, and three-month gains then ran 30.7%, 43.4%, and 80.1%.
Today’s are milder at 32.5%, 28.4%, and 59.0%, but still huge and getting into that topping ballpark. To me after a long quarter-century intensely studying gold, actively trading gold and silver stocks, and writing financial newsletters about it all, silver’s behavior didn’t get unusual until just these last several weeks. On Black Friday which is a low-volume throwaway day, silver soared 5.5% to a new record close of $56.13.
That day gold closed 3.1% under its own recent mid-October peak, so seeing silver decouple and surge 4.1% above its own was fascinating. Silver’s upside breakout from gold’s influence has accelerated from there, including big additional up days so far in December of 3.2%, 2.2%, 4.5%, 2.9%, 3.3%, and 4.5%!That’s been remarkable, fueled by fear-of-missing-out and momentum-chasing buying on short-squeeze rumors.
I’ve read everything I could find on the latter in recent weeks, but haven’t yet seen any convincing hard evidence. There are signs implying physical-silver shortages, such as higher lease rates and larger price differentials between major markets like London, Shanghai, and New York. World silver trading is forever shrouded in opacity, with reliable supply-and-demand data sparse. The best is only published once per year!
The Silver Institute releases its fantastic World Silver Survey reports around April, covering prior calendar years. So we are still many months away from understanding 2025’s global physical-silver flows. But the reason I wrote this essay is a couple fascinating developments in silver overboughtness and silver-futures trading. Both imply silver’s near-parabola isn’t yet particularly extreme, so it may still have gas left in the tank.
Yet a critical caveat is the vast majority of the time silver is highly correlated with gold. So if the yellow metal soon rolls over hard into a major drawdown or drifts significantly lower in its high-consolidation trading range, silver will almost certainly get sucked into that selling and amplify it. That tendency was just on display again recently. In late October silver plunged 13.4% in under two weeks as gold dropped 7.4%, for 1.8x.
This chart superimposes silver and its key technicals over speculators’ weekly silver-futures positioning over these last several years. Total spec longs or upside bets are rendered in green, and total spec shorts or downside ones in red. Silver’s recent near-parabola sure looks parabolic on this chart, a vertical surge dominating everything else!Again that hasn’t been around long, only soaring in this last month or so.
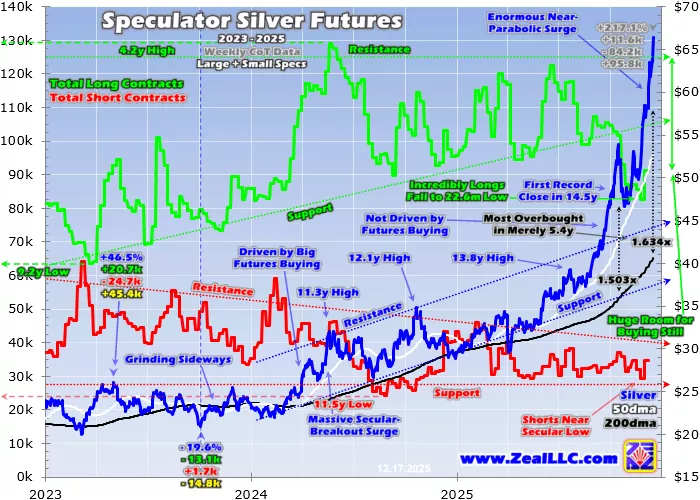
Starting on the overboughtness front, midweek silver’s latest record $66.41 close stretched a huge 63.4% above its baseline 200-day moving average!The latter is drawn in black here. Looking at prices as multiples of their trailing 200dmas then charted over time reveals when these prices wax extremely overbought which portends big imminent rebalancing selloffs or extremely oversold flagging great buying ops.
Silver skyrocketing to 1.634x its 200dma is very extreme by recent standards. Based on silver’s trading in the past five calendar years, that extreme-overboughtness threshold starts at just 30% over its 200dma. Silver first exceeded that recently in late September, soared as high as 1.503x in mid-October, then later again to this week’s 1.634x. But rather surprisingly, that’s “merely” a 5.4-year high in silver overboughtness.
That qualifier is because in mid-October gold skyrocketed to a far-more-extreme 19.5-year high relative to its own 200dma! That extended all the way back to May 2006, compared to just August 2020 for silver. That month as silver’s post-COVID-lockdown 142.8% bull peaked, silver stretched a higher-yet-similar 65.9% above its 200dma. But that sure wasn’t near-term bullish, as silver corrected fairly-hard out of that.
Over the next seven weeks or so, silver plunged 21.1% on a parallel 8.1% gold selloff for 2.6x downside leverage. Interestingly at midweek gold levels, the bottom of its recent high-consolidation trading range is a similar 9.4% lower. Make no mistake, if gold sells off into the lower end of that sideways drift it is going to drag silver with it. Because of that, I sure wouldn’t chase silver way up here despite its futures situation.
Normally when prices shoot vertical, hyper-leveraged futures speculators flood in exacerbating both those surges and subsequent symmetrical plunges. But so far according to government-shutdown-delayed spec silver-futures-positioning data, that hasn’t happened. Incredibly those futures guys have mostly been selling as silver soared since mid-summer!That recently left them with much capital firepower to buy and chase.
Each silver-futures contract controls 5,000 ounces of silver worth $332k midweek. Yet speculators are now only required to maintain cash margins of $22k in their accounts for each contract traded. That makes for extreme maximum leverage of 15.1x, far beyond the half-century-old 2x legal limit in the stock markets!At 15x, each dollar traded in silver futures has 15x the price impact on silver as a dollar invested outright.
So big silver surges and plunges are often partially-to-mostly fueled by big silver-futures buying and selling respectively. Buying means both adding longs and covering shorts, while selling includes exiting longs and adding shorts. But as spec longs have outnumbered shorts by an average of 3.0x over the past 52 reported Commitments-of-Traders weeks, longs are proportionally more important in driving silver prices.
Total spec longs last crested at 122.4k contracts way back in mid-June, fully a half-year ago!That was just under recent years’ secular resistance near 125k. Since silver-futures trading is so crazy-risky, only a small group of traders is involved with quite-finite capital before extreme leverage. So if total spec longs were up near buying-exhausting levels today, that would portend an imminent big-and-fast plunge in silver prices.
Examples of this are evident in this chart in both mid-2024 and early 2025. While 15.1x leverage is fun when silver is surging, it is catastrophic when silver reverses lower. At that maximum leverage, a mere 6.6% silver selloff would wipe out 100% of speculators’ capital risked!So they can’t afford to be wrong for long if running minimum margins. Once they see silver sell off, they have to rush to join in before getting gutted.
So silver-futures selling out of high longs often cascades, feeding on itself and quickly hammering silver prices much lower. In mid-June when spec longs were dangerously high, silver was still down near $37. Amazingly these guys have mostly liquidated longs on balance ever since, even as silver blasted much higher into this near-parabola. By late November, total spec longs fell back to a deep 22.6-month low of 82.8k!
Silver already surged much higher then, just over $51. Yet speculators still had huge room for buying since spec longs were so far under resistance!The last time they had been that low was in mid-January 2024 early in silver’s bull. Silver was under $23 then, and would soar 45% into mid-April that year on massive spec silver-futures long buying. As this chart shows, spec longs shot to a 4.2-year high in that span.
That also included big short-covering buying, which isn’t likely today since spec shorts have been hovering not far above major secular lows. But it is remarkable and quite-bullish for silver to see spec futures longs way back down to early-bull levels as silver started shooting vertical recently. These hyper-leveraged traders had lots of room to chase silver higher amplifying its gains, which may have happened after.
But this analysis is lagging because of the record-long government shutdown into mid-November. During that, the Commodity Futures Trading Commission didn’t publish any weekly CoT reports so no one knew what silver-futures specs were doing. Seven of those were missed, and once the government reopened publishing soon resumed in chronological order starting with the oldest. So CoT reporting still isn’t caught up!
For much more detail on this, a couple weeks ago I published a popular essay on Gold’s Futures Plot Twist which is similar to silver’s. As gold soared into mid-October, specs were unusually dumping gold-futures longs while the government shutdown masked their trading. The CFTC has been releasing new CoTs at a one-to-three-reports-per-week pace, depending on holiday schedules. The latest is December 2nd’s.
It was in the prior November 25th one that spec silver-futures longs fell to that extraordinary 22.6-month low, when silver was still down near $51. In the three weeks since, silver has blasted 29.3% higher in that near-parabolic breakout!So this latest surge could’ve very well been fueled by spec silver-futures buying. That latest December 2nd CoT seemed to show that, with spec longs surging as silver soared higher.
During that CoT week, silver launched up an extreme 13.9% partially driven by spec longs surging by 8.6k contracts to 91.4k! That’s still on the low side of recent years’ trading range, but since then silver has powered another 13.5% higher. So spec longs could very well be much higher and way-more-bearish now than they were in late November. What happened in longs in December may prove telling for silver.
The December 9th delayed CoT report is coming out late on the 19th, then the next current to the 16th is scheduled to be published late on the 23rd. Either or both together could still scuttle this spec-silver-futures-positioning-still-bullish-for-silver picture. But with all the catch-up CoT data available when this essay was published, speculators’ relatively-low longs looked surprisingly bullish for so late in a major silver bull!
Circling back to where we started, silver parabolas can grow a heck of a lot bigger than what we’ve seen recently. Frenzied silver-futures buying as speculators chase silver’s upside momentum can be a big part of fueling parabolic moonshots. But given silver’s history of symmetrical plunges soon after such sharp gains, I wouldn’t even think about buying silver or silver-mining stocks with it stretched almost 65% above its 200dma!
Successful speculation and investment demands buying relatively-low before later selling relatively-high. And silver’s recent many-record-achieving vertical surge proves it is nowhere near relatively-low!Way up here the risk of big-and-fast selloffs anytime dwarfs further parabola-like upside. So it’s prudent to bide your time now, study silver and silver stocks but wait for them to come in rather than chasing a probable topping.
Increasingly-greedy herd sentiment argues silver’s near-parabola is precarious. Nearly everyone is very bullish on silver after its breakout surge, and both fear-of-missing-out and momentum-chasing buying have exploded. Proportional selloffs are necessary after vertical surges to slay resulting extreme greed. As legendary investor Warren Buffett wisely advised, as contrarians we need to be afraid when others are brave.
The bottom line is silver just soared in a near-parabola, generating much excitement. While vertical, silver’s gains are nowhere near as extreme as true parabolas. Silver didn’t get as crazy-overbought as gold, and speculators aggressively dumped silver futures as the metal soared. That left their positioning surprisingly bullish for silver in late November, with huge room available to rebuild longs amplifying silver’s gains.
But unfortunately crucial spec silver-futures-positioning data continues to be delayed from the government shutdown. So these hyper-leveraged traders already flooding back in could’ve fueled silver’s latest surge. With silver still extremely overbought and herd greed soaring, downside risks abound. Silver will get sucked into and amplify any material gold selling back to the lower end of its high-consolidation trading range.
More By This Author:
Gold Consolidating High AgainGold’s Futures Plot Twist
Essential Gold Investing


