Silver, Shine On Me
If you go to eBay (EBAY), you will find prices for physical silver to be at least 20% higher per ounce than the spot price. This supply/demand imbalance has been persistent now for many weeks already. I imagine the next few months will not be as favorable as usual for the investor at this time of year. I also imagine it will not be as quiet as usual, and I wonder what this might do to silver prices.
Some speculate that a market crash that drags all asset groups down is inevitable. This might be the case – or not. We find a “wait and see” approach in looking for a cheap spot price to acquire physical silver a high risk. A more conservative move may be appropriate. No need to fill the vault if you find prices overbought. However, avoiding accumulating the shiny metal in even small amounts could lead to not getting any at all.
In the modern world, we tend to look for a bargain. In trading, this easily supersedes even greed. Think value. One of the greatest benefits to having a few silver coins at home is psychological stability. It feels good to know that you have a barter as a last resort. There are reasons why we have used silver for more than 2,500 years as a means for exchange.
Even if you never have to tap into your backup plan, holding small denomination physical silver is likely, for long holding periods, to provide the additional growth in value. It is a good investment for your children, a tangible legacy of you caring and thinking ahead.
Silver, Daily Chart, History repeating itself – Silver, shine on me:

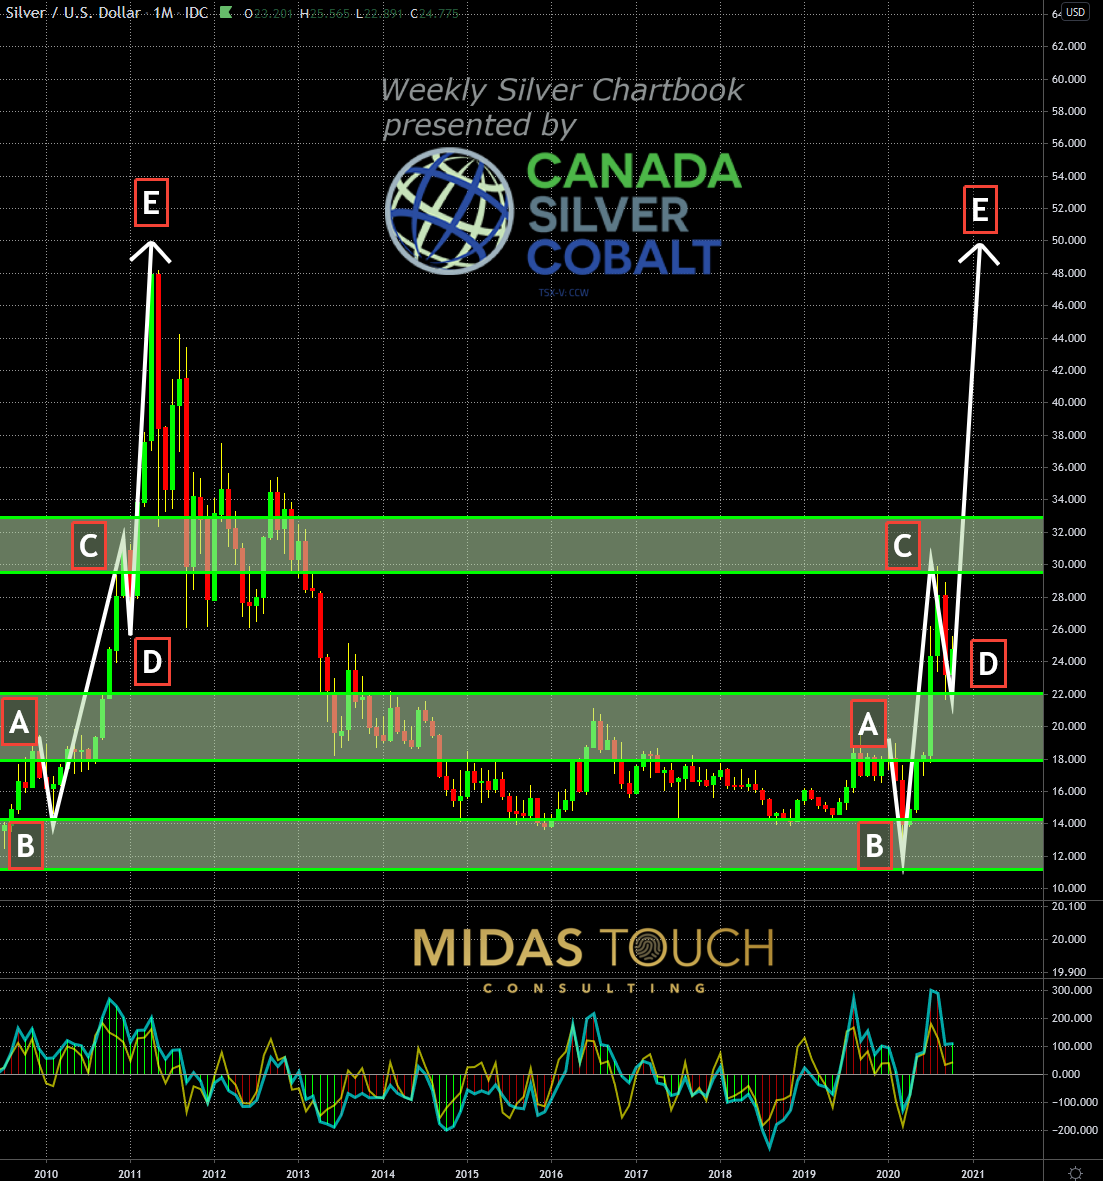
Silver in US Dollar, monthly chart as of October 23rd, 2020
Looking at the monthly chart above, we find that silver has been trading for long periods in the range between $14 to $19. The last time it broke this range to the upside was in the second quarter of 2010. This breakout was preceded by a steep swift move down (A to B) through the whole range with an immediate bounce of 100%.
This proves to be similar this year. We also broke in the second half of the year through $19, precisely ten years later, and had an identical preceding move. Prices found resistance near the $31 area (C) in 2010. They have just recently bounced from the same distribution zone (C), as well.
And in 2011, silver nearly doubled in just three months’ time (E). Probabilities show that silver could experience a steep move like this in the present time, as well. You do not want to get caught chasing a possibly dwindling decline in the shiny metal.
Silver, Daily Chart, Range contraction before election:

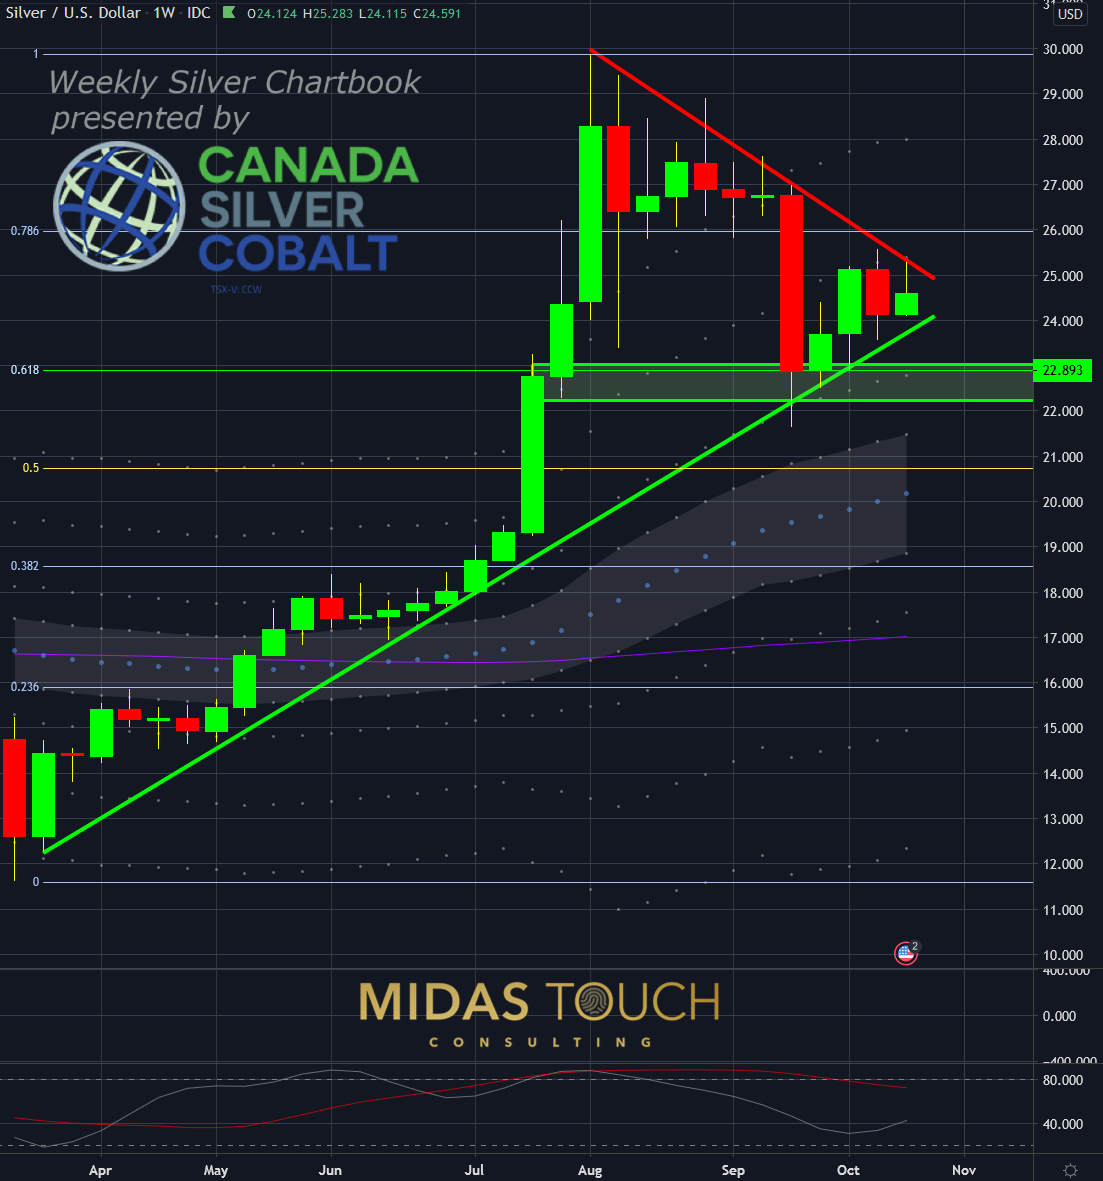
Silver in US Dollar, weekly chart as of October 23rd, 2020
The weekly time frame shows silver prices are in a directional advantage with a bullish triangle formation. After a price advance up to $30, a natural decline from extended standard deviation levels (dotted lines) occurred over the last 11 weeks. There is a good probability for a price decline breaking through the green support trendline.
A fractal zone of support and the Fibonacci support levels of 0.618 and 0.5 are looking for a possible bounce. Breaking in the direction of the trend could catapult prices quickly by a 20% increase from $25 back to $30 again.
Silver, Daily Chart, Stuck in a tight range:

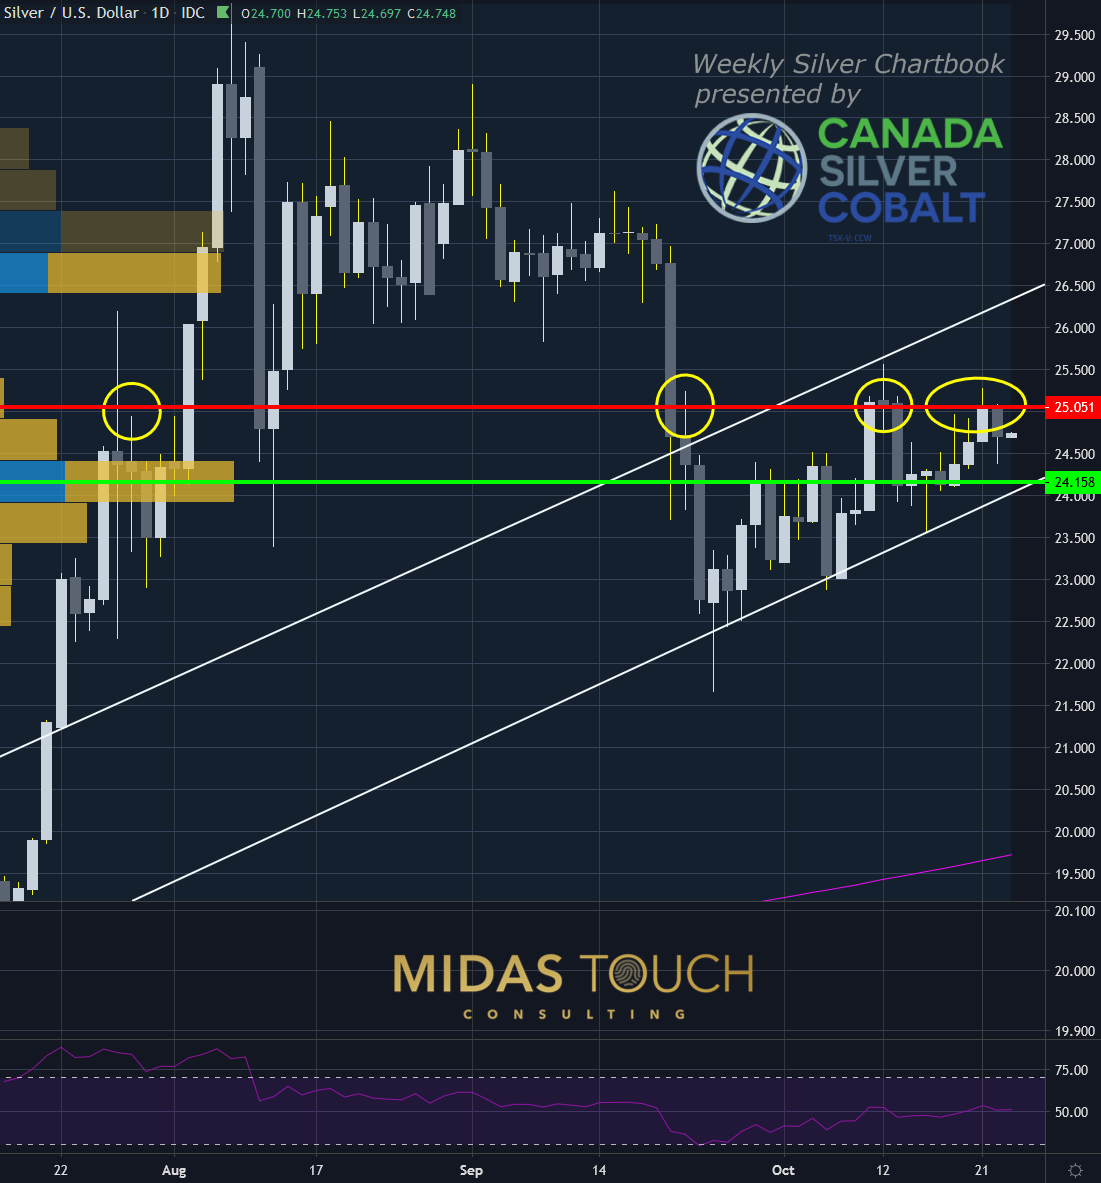
Silver in US Dollar, daily chart as of October 23rd, 2020
The daily chart shows two predominant factors. For one, a volume analysis indicates a strong support zone at $24.15 (green horizontal line). And secondly, the round number of $25 is significant resistance (red horizontal line). This week’s trading was dominated by $25 acting as a magnet to the price.
The indecisive aspect of the price on this smaller timeframe, with no clear resolution for direction, does not provide for an anticipated low-risk entry point. As such, letting price behavior guide the trader for the possible breakout direction is the sensible course of action.
Silver, shine on me
We see value flowing from paper money to tangibles. We noticed the used car market to have increased on single-vehicle base prices by an unusual percentage. If odd markets like these find an imbalance at their supply/demand ratios, couldn’t it be concluded that a haven as obvious as silver might not be likely to see bargain values right now? You might see high volatility in spot prices soon, but that doesn’t mean you will be able to stock up on physical silver for cheap.


Good post, thanks.