Silver Price Forecast: XAG/USD Trades Below $32.50, Nine-Day EMA
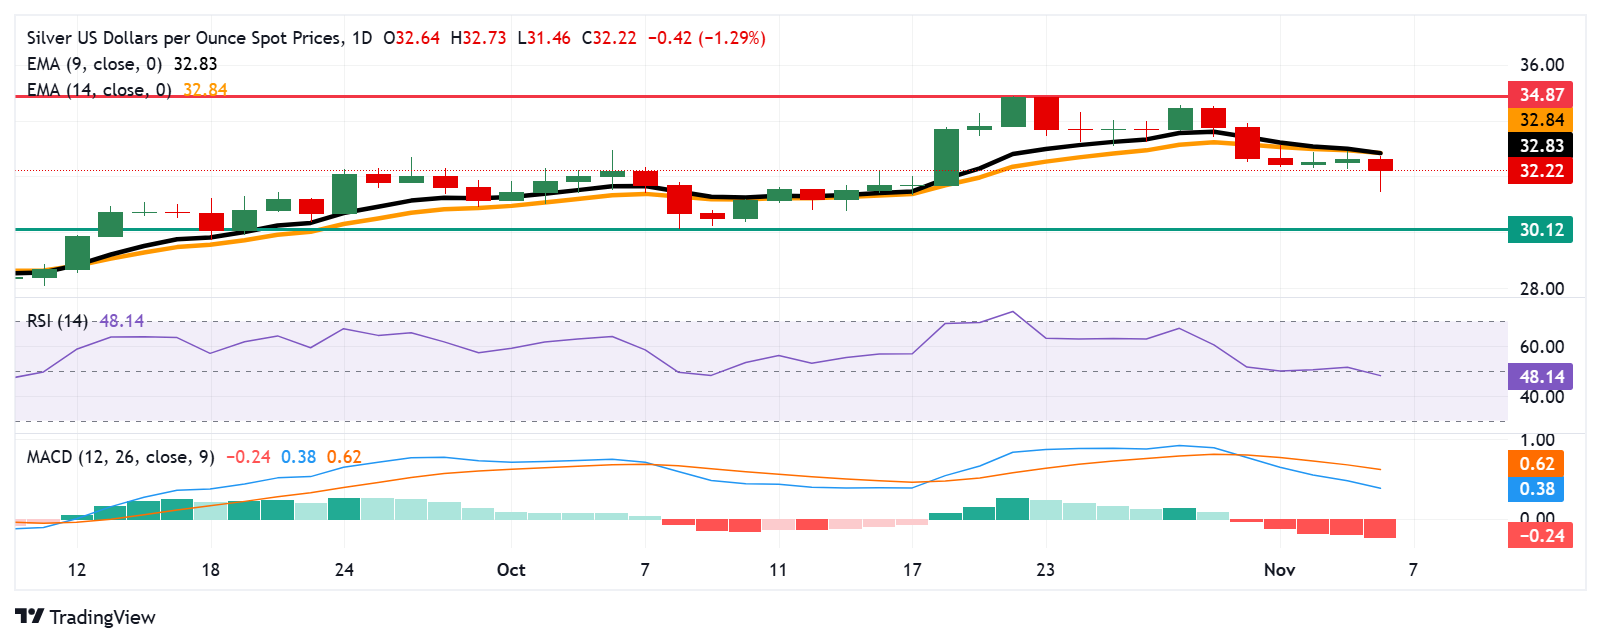
Silver price (XAG/USD) depreciates to near $32.20 during the European session on Wednesday. The daily chart analysis indicates a potential shift in momentum from bullish to bearish, as the nine-day Exponential Moving Average (EMA) aligns with the 14-day EMA. A downward crossover here would signal weakening short-term momentum.
Additionally, the 14-day Relative Strength Index (RSI) is consolidating just below the 50 level, indicating an ongoing bearish bias. However, traders would like to see further movement to gain a clear trend direction for the XAG/USD pair.
Moreover, the Moving Average Convergence Divergence (MACD) line diverging below the signal line suggests a potential bearish pressure on the Silver price. Despite this, the overall trend remains bullish as the MACD line remains above the centerline (zero line).
On the downside, Silver price may encounter immediate support at the psychological level of $32.00. A drop below this level could exert downward pressure on the precious metal, potentially pushing the price toward the seven-week low at $30.12, recorded on October 8.
In terms of the upside, the Silver price could target the nine- and 14-day EMAs at the $32.83 and $32.84 levels, respectively. A breakthrough above these EMAs could trigger a shift toward a bullish bias, with the potential for the price to revisit the area near the all-time high of $34.87, reached on October 22.
XAG/USD: Daily Chart
(Click on image to enlarge)
More By This Author:
USD/CAD Depreciates Toward 1.3850 Amid Stable Oil Prices On Us Election DaySilver Price Forecast: XAG/USD Moves Above $32.50 Due To Caution Ahead Of Us Election
USD/CHF Dips Toward 0.8650 As The US Dollar Weakens Amid Lower Treasury Yields
Information on these pages contains forward-looking statements that involve risks and uncertainties. Markets and instruments profiled on this page are for informational purposes only and should not ...
more


