
Silver price (XAG/USD) bounces back strongly from the crucial support of $29.00 in Tuesday’s American session. The white metal struggles to gain ground even though the United States (US) Retail Sales grew meagrely by 0.1%, slower than expectations of 0.2% after contracting by 0.2% in April, downwardly revised from a stagnant performance.
The US Census Bureau reports that households cut heavily on discretionary items as banks remain reluctant to increase credit growth due to fears of an increase of delinquency costs. Sales at service stations were lower due to soft gasoline prices.
Slower-than-expected Retail Sales growth suggests deepening household crises due to higher interest rates by the Federal Reserve (Fed). This has weighed on the US Dollar (USD) and bond yields. The US Dollar Index (DXY), which tracks the Greenback’s value against six major currencies, surrenders its entire losses and drops to 105.30.
10-year US Treasury yields slump to 4.25%. Lower yields on interest-bearing assets reduce the opportunity cost of holding an investment in non-yielding assets, such as Silver.
Slower growth in the US Retail Sales has boosted expectations of early rate cuts by the Federal Reserve (Fed). The CME FedWatch tool shows that the probability for rate cuts in the September meeting has increased to 67% from 61.5%, recorded on Monday.
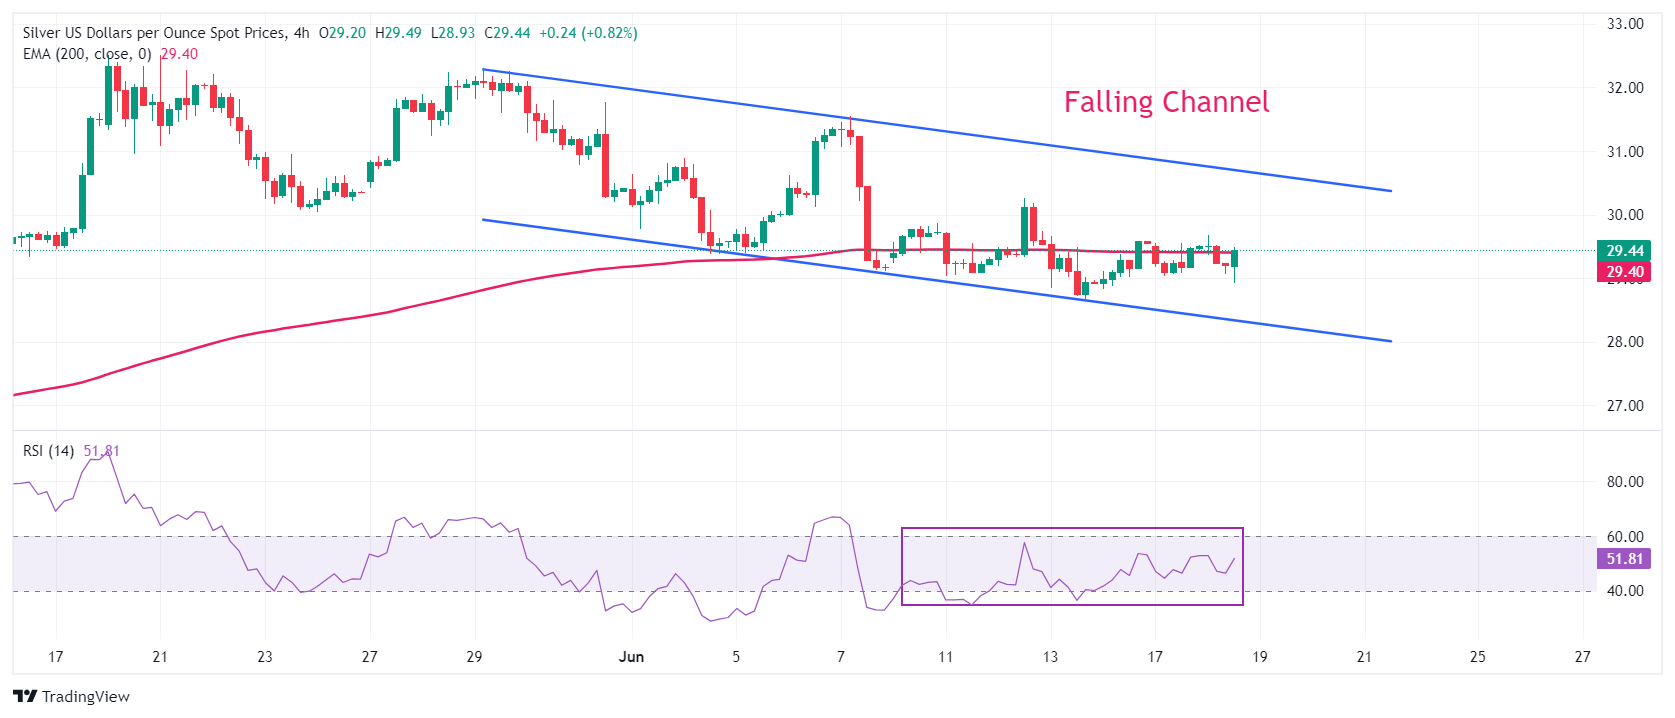
Silver technical analysis
Silver price trades in a Falling Channel chart pattern in which each pullback is considered as a selling opportunity by market participants. The asset aims to shift above the 200-period Exponential Moving Average (EMA), which trades around $29.40.
The 14-period Relative Strength Index (RSI) oscillates in the 40.00-60.00 range, suggesting a consolidating ahead.
Silver four-hour chart
(Click on image to enlarge)
XAG/USD
| OVERVIEW | |
|---|---|
| Today last price | 29.47 |
| Today Daily Change | 0.01 |
| Today Daily Change % | 0.03 |
| Today daily open | 29.46 |
| TRENDS | |
|---|---|
| Daily SMA20 | 30.41 |
| Daily SMA50 | 29 |
| Daily SMA100 | 26.47 |
| Daily SMA200 | 24.81 |
| LEVELS | |
|---|---|
| Previous Daily High | 29.58 |
| Previous Daily Low | 29.03 |
| Previous Weekly High | 30.26 |
| Previous Weekly Low | 28.66 |
| Previous Monthly High | 32.51 |
| Previous Monthly Low | 26.02 |
| Daily Fibonacci 38.2% | 29.24 |
| Daily Fibonacci 61.8% | 29.37 |
| Daily Pivot Point S1 | 29.14 |
| Daily Pivot Point S2 | 28.81 |
| Daily Pivot Point S3 | 28.59 |
| Daily Pivot Point R1 | 29.68 |
| Daily Pivot Point R2 | 29.9 |
| Daily Pivot Point R3 | 30.23 |
More By This Author:
GBP/JPY Recovery Stalls Near 200.00 As Focus Shifts To UK InflationUSD/JPY Rises Further Above 158.00 As US Dollar Extends Recovery
USD/CAD Holds Key Support Of 1.3700 Ahead Of US Retail Sales


Comments
Log in or sign up to join the conversation.