

Image Source: Pixabay
- Silver rebounds sharply on Wednesday after falling to its lowest level since August 4.
- The rebound follows a pullback in the US Dollar, as political pressure mounts on the Fed after President Trump calls for Governor Lisa Cook's resignation.
- Traders await the release of the FOMC July meeting minutes, which could offer fresh clues on the Fed’s inflation outlook and rate trajectory.
Silver (XAG/USD) stages a sharp recovery on Wednesday after sliding to its lowest level in over two weeks, since August 4. The rebound comes as the US Dollar (USD) lost ground following renewed political pressure on the Federal Reserve (Fed), with US President Donald Trump publicly calling for the resignation of Fed Governor Lisa Cook. The safe-haven appeal of Silver re-emerged, helping the metal bounce from session lows.
At the time of writing, Silver is trading around $37.80, up nearly 1.0% on the day, having rebounded strongly from an intraday low of $36.96. The bounce coincides with growing market caution ahead of the release of the Federal Open Market Committee (FOMC) July meeting minutes at 18:00 GMT, which could offer insight into the Fed’s evolving inflation outlook and interest rate path.
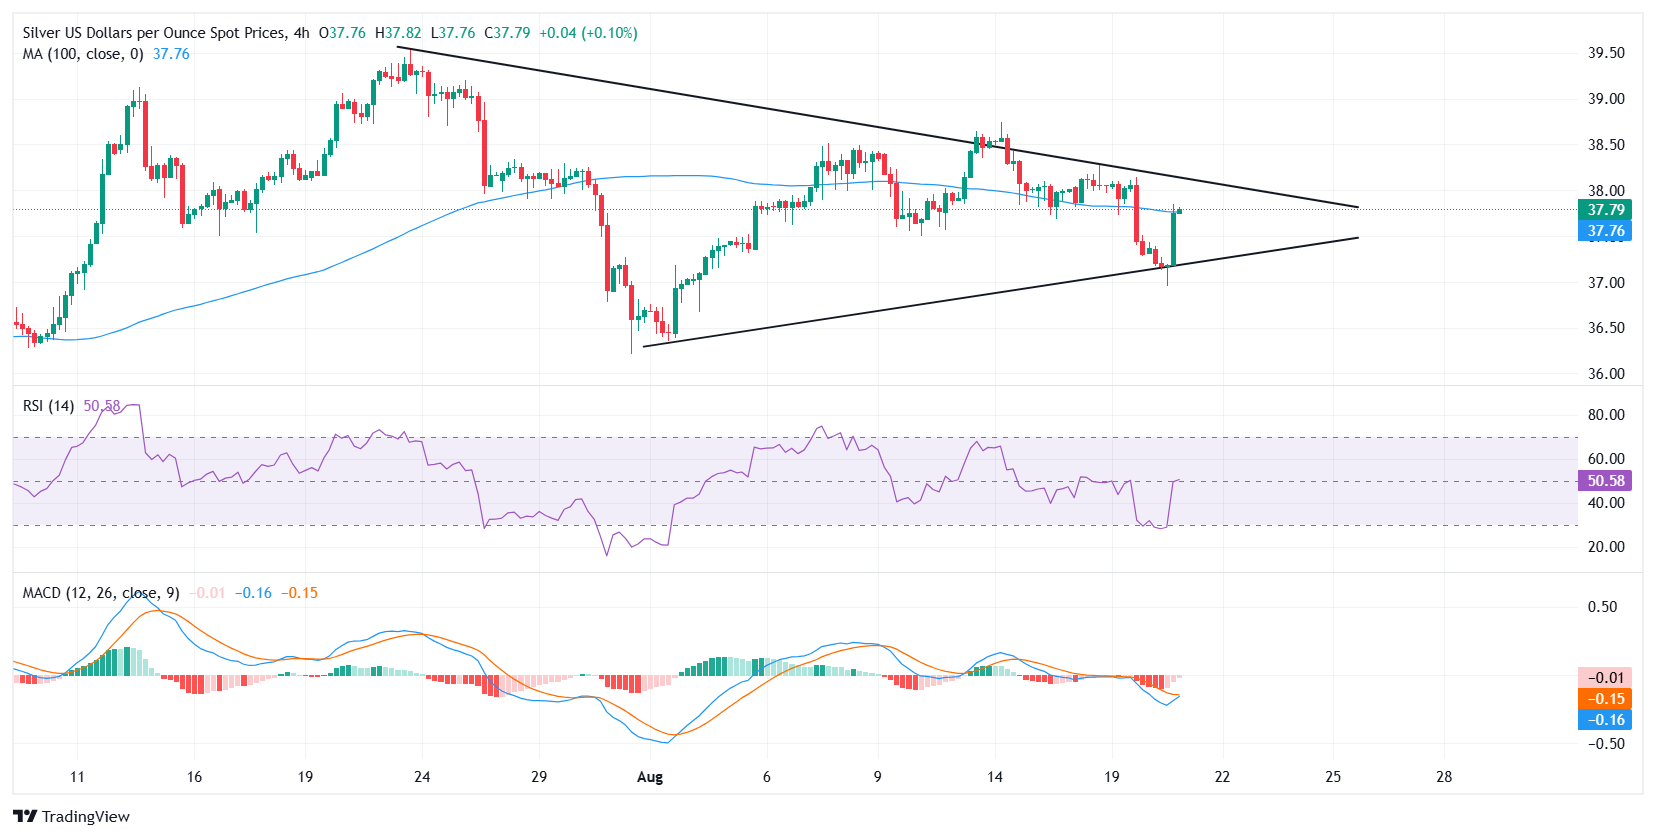
From a technical standpoint, Silver is trading within a symmetrical triangle pattern on a 4-hour chart. The price rebounded sharply from the lower boundary of the triangle formation near $37.00, where buyers re-emerged and defended key support. This bounce has brought the metal back toward the 100-period Simple Moving Average (SMA), which now acts as immediate resistance near $37.76.
A sustained break above the 100-SMA could pave the way for a retest of the triangle’s upper boundary near the $38.20 psychological level. A confirmed breakout above this confluence zone would likely accelerate bullish momentum, exposing the next upside targets at $38.74—the August 14 swing high, followed by $39.53, which marks the multi-year peak.
Momentum indicators are showing early signs of a potential bullish shift. The Relative Strength Index (RSI) has rebounded after briefly dipping into oversold territory, now climbing back toward the midline, which reflects improving intraday strength and fading bearish pressure. Meanwhile, the Moving Average Convergence Divergence (MACD) histogram is narrowing, and the MACD line is approaching a bullish crossover above the signal line, another indication that downside momentum is weakening and a reversal may be underway.
On the downside, failure to clear the 100-SMA may keep the metal confined within the triangle structure. A break below the $37.00 support could trigger a bearish breakdown, exposing the next support levels at $36.50 and $35.90.
More By This Author:
Canadian Dollar Steadies As Fed Minutes And Political Tensions Weigh On GreenbackGold Rebounds As U.S. Dollar Weakens, Trump Calls For Fed Governor Cook’s Resignation
Gold Sticks To Recovery Gains; Lacks Bullish Conviction Ahead Of FOMC Minutes


Comments
Log in or sign up to join the conversation.