

Image Source: Pixabay
Silver prices are recovering from earlier lows, supported by renewed demand at technical support levels.
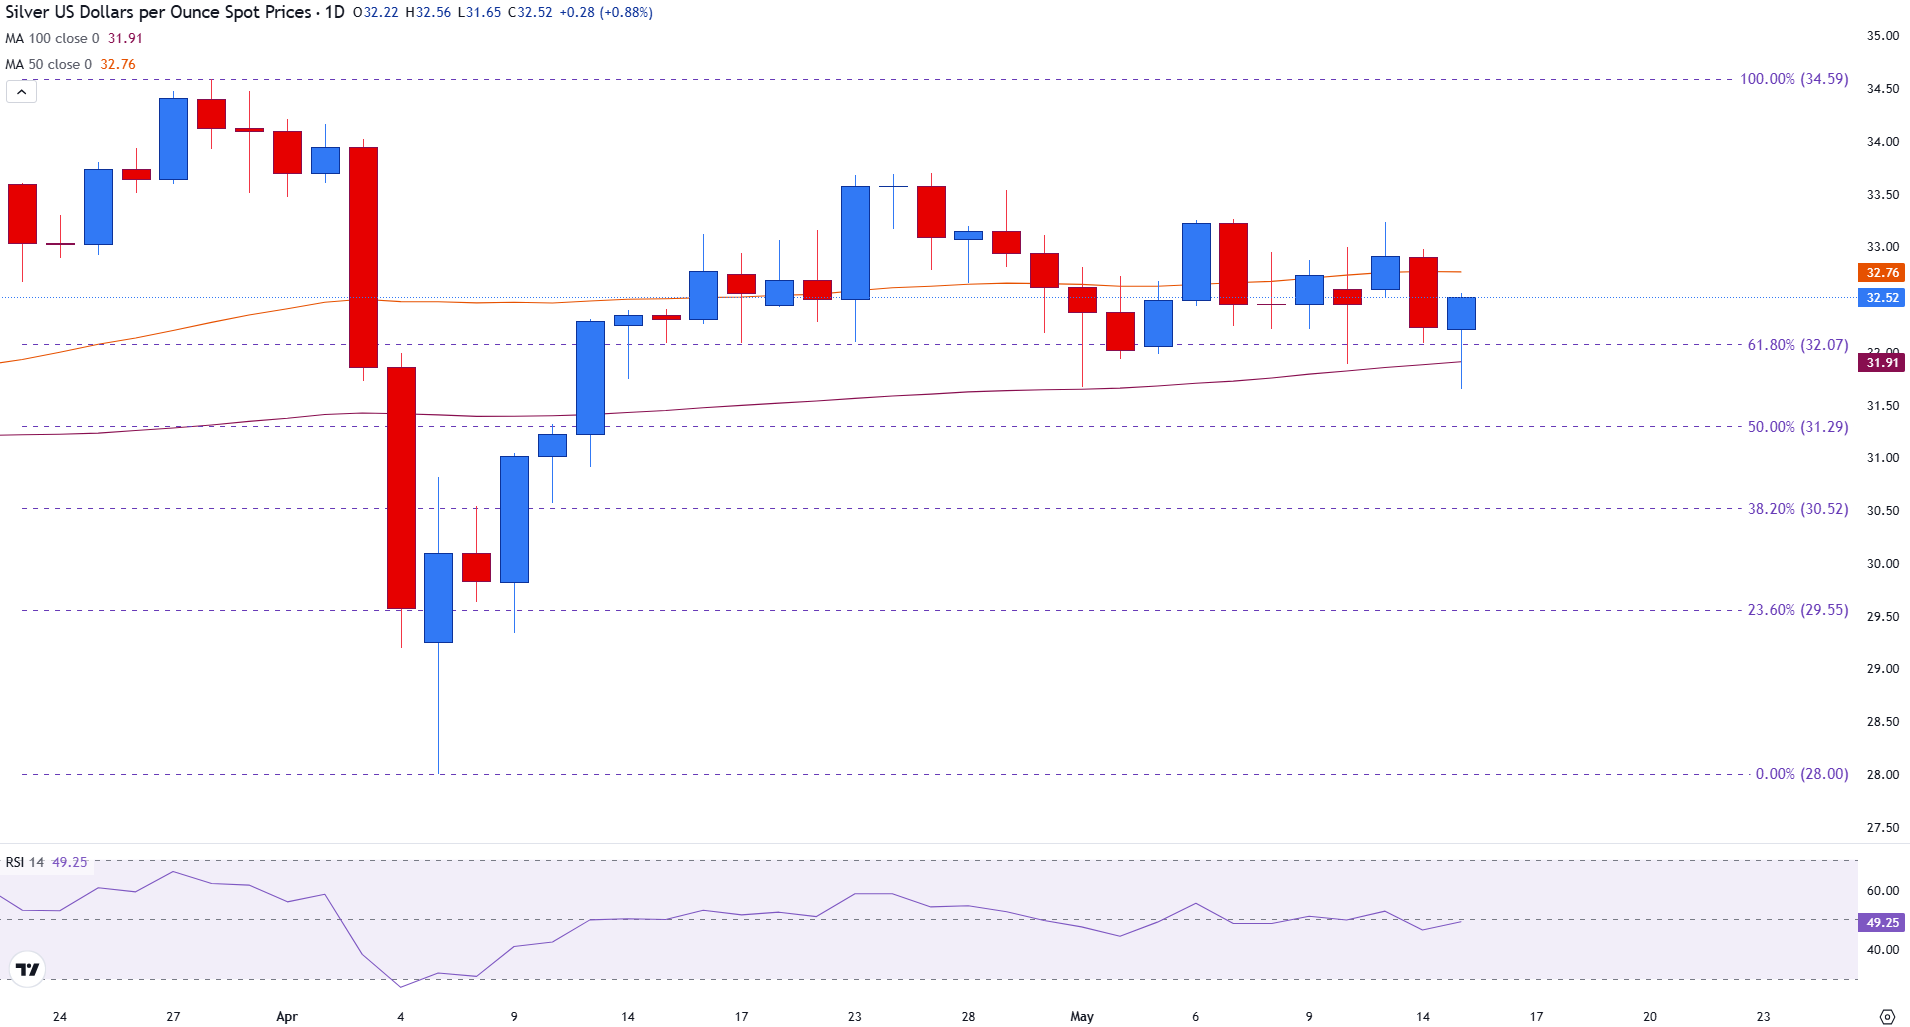
At the time of writing, XAG/USD is up 0.90% on the day, trading near $32.53, after briefly dipping below the 100-day Simple Moving Average (SMA) at $31.90.
The advance reflects increased buying interest, although the broader market remains consolidative. Investors continue to weigh mixed United States (US) economic data and evolving expectations around Federal Reserve (Fed) policy, leaving Silver confined within a well-defined trading range.
Silver bounces off support as buyers regain control
On the daily chart, the current candlestick features a small real body near the top of a long lower wick — a classic sign of intraday bearish pressure that was ultimately rejected.
Buyers stepped in at the 100-day SMA, pushing prices back toward the session’s opening level. While this does not confirm a bullish reversal, it highlights strong demand at lower levels. The candle represents a defensive stance by buyers rather than a clear trend change. However, with the trading day still in progress, a confirmed close is needed to validate the move.
Silver remains constrained between the 100-day SMA at $31.90 and the 50-day SMA at $32.76, with additional resistance at the psychological $33.00 level. Immediate support aligns with the 61.8% Fibonacci retracement of the March–April rally, near the $32.00 mark. The Relative Strength Index (RSI) on the daily chart stands at 47.68, indicating a neutral momentum profile.
Silver (XAG/USD) daily chart
(Click on image to enlarge)
Weekly chart highlights potential shift in momentum
On the weekly timeframe, Silver appears to be forming a bullish harami pattern — a smaller bullish candle developing within the body of last week’s larger bearish candle. This configuration often signals a potential loss of bearish momentum, particularly when it occurs near established support levels. In this case, Silver is holding above the 23.6% Fibonacci retracement of the 2024 advance, located at $31.81.
Silver (XAG/USD) weekly chart
(Click on image to enlarge)

The 10-week and 50-week SMAs, positioned at $32.57 and $30.95, respectively, are gradually converging, indicating a tightening technical structure. The Relative Strength Index (RSI) on the weekly chart is at 52.75, reflecting a mildly bullish bias but no strong momentum either way. A sustained breakout above $33.69 or a confirmed close below $31.80 would likely determine the next directional move for Silver.
More By This Author:
USD/JPY Slides As BoJ Hawkish Shift Clashes With Fed Dovish TiltFed Rate Decision In Focus Post Elections, BoE Drives GBP/USD Higher


Comments
Log in or sign up to join the conversation.