Silver Price Forecast: XAG/USD Plummets To $28.40 As Uncertainty Over Fed Rate Cut Timing Deepens
Silver price (XAG/USD) slumps to $28.40 in Tuesday’s European session. The white metal faces intense selling pressure as the US Dollar extends its upside to more than five-month high around 106.40. The US Dollar strengthens after robust United States Retail Sales data for March deepened uncertainty about when the Federal Reserve (Fed) will start reducing interest rates.
S&P 500 futures have posted some losses in the European session, portraying a decline in the risk appetite of the market participants. 10-year US Treasury yields hover near a fresh five-month high around 4.63%. US bond yields extend their upside on expectations that the Fed will delay rate cuts later this year. The US Dollar Index (DXY) rises to 106.33 and continues its winning streak for the fifth trading session on Tuesday.
Fed policymakers see no urgency for a reduction in interest rates. San Francisco Fed Bank President Mary Daly emphasized keeping the monetary policy restrictive until policymakers get convinced that inflation is on course towards the 2% target.
The near-term outlook of Silver remains strong amid fears that tensions in the Middle East region could spread beyond Gaza. After a cabinet meeting on Monday with Israel Prime Minister Benjamin Netanyahu, Israel’s military Chief of Staff Herzi Halev said they would respond to Iran’s attack on their territory. On Saturday, Iran launched hundreds of drones and missiles to retaliate against Israel’s attack on the Iranian embassy in Syria near Damascus, in which two high-ranked generals died.
Silver technical analysis
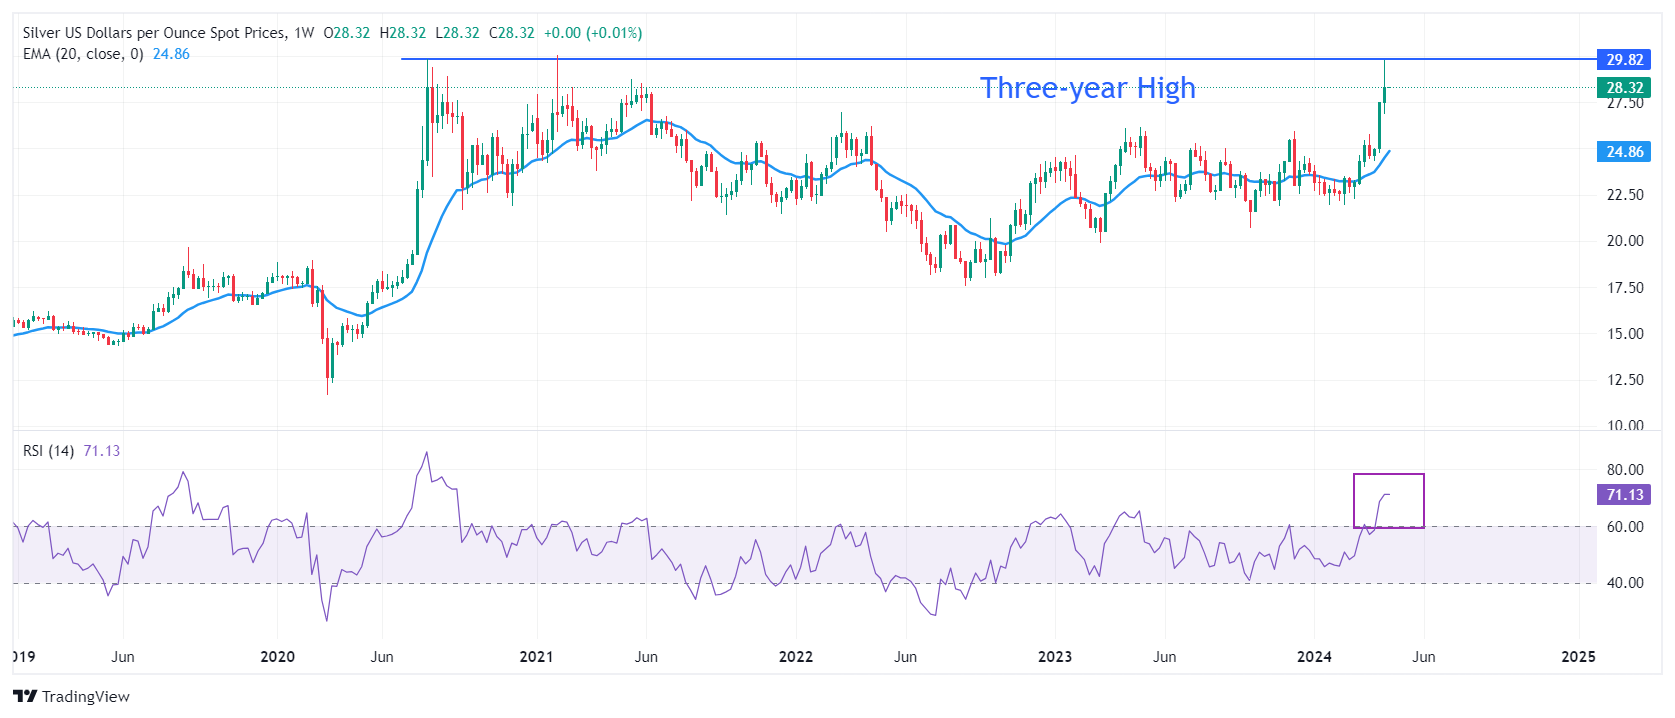
Silver price faces selling pressure while attempting to break above horizontal resistance plotted from 3 August 2020 high at $29.86. The long-term outlook of the white metal is bullish as the 20-week Exponential Moving Average (EMA) at $24.85 is sloping higher.
The 14-period Relative Strength Index (RSI) shifts into the bullish range of 60.00-80.00, suggesting a strong upside momentum.
Silver weekly chart
(Click on image to enlarge)
XAG/USD
| OVERVIEW | |
|---|---|
| Today last price | 28.28 |
| Today Daily Change | -0.59 |
| Today Daily Change % | -2.04 |
| Today daily open | 28.87 |
| TRENDS | |
|---|---|
| Daily SMA20 | 26.28 |
| Daily SMA50 | 24.46 |
| Daily SMA100 | 24 |
| Daily SMA200 | 23.63 |
| LEVELS | |
|---|---|
| Previous Daily High | 28.89 |
| Previous Daily Low | 27.62 |
| Previous Weekly High | 29.8 |
| Previous Weekly Low | 26.88 |
| Previous Monthly High | 25.77 |
| Previous Monthly Low | 22.51 |
| Daily Fibonacci 38.2% | 28.41 |
| Daily Fibonacci 61.8% | 28.11 |
| Daily Pivot Point S1 | 28.03 |
| Daily Pivot Point S2 | 27.19 |
| Daily Pivot Point S3 | 26.77 |
| Daily Pivot Point R1 | 29.3 |
| Daily Pivot Point R2 | 29.73 |
| Daily Pivot Point R3 | 30.57 |
More By This Author:
USD/CAD Price Analysis: Corrects To 1.3730 Ahead Of US Retail Sales DataUSD/CHF aims to surpass 0.9150 as US Dollar remains upbeat, US Retail Sales in focus
EUR/USD Tumbles To 1.0660 On Firm ECB Rate Cut Bets For June
Information on this article contains forward-looking statements that involve risks and uncertainties. Markets and instruments profiled on this page are for informational purposes only and should not ...
more


