
Silver Price Forecast: XAG/USD Plummets To $26 Despite Weak US NFP Data
Silver price (XAG/USD) reverses gains and falls sharply to $26.00 despite the United States Nonfarm Payrolls (NFP) data for April turned out weaker than expected. The US NFP report showed that employers hired 175K job-seekers, weaker than the consensus of 243K and the prior reading of 315K, upwardly revised from 303K. The Unemployment Rate rises to 3.9% while investors forecasted it to remain steady at 3.8%.
The Average Hourly Earnings, which feeds the consumer spending and eventually reflects the inflation outlook, softened to 3.9%. Investors forecasted the wage growth to decelerate to 4.0% from March’s reading of 4.1%. Monthly wage growth data grew at a slower pace of 0.2%, against the estimates and the prior reading of 0.3%.
Weak labor demand and soft wage growth would force the Federal Reserve (Fed) to unwind its restrictive policy framework earlier, which it has been maintaining for almost two years. Currently, investors expect that the Fed will start reducing interest rates from the September meeting. The situation is unfavorable for the US Dollar and Treasury yields. The US Dollar Index (DXY), which tracks the Greenback’s value against six major currencies, prints a fresh three-week low around 104.50. 10-year US Treasury Yields weaken to 4.49%.
Generally, lower yields on interest-bearing assets weigh on non-yielding assets such as Silver as they reduce the opportunity cost of holding investment in them. Therefore, the Silver price could reverse losses ahead.
Silver technical analysis
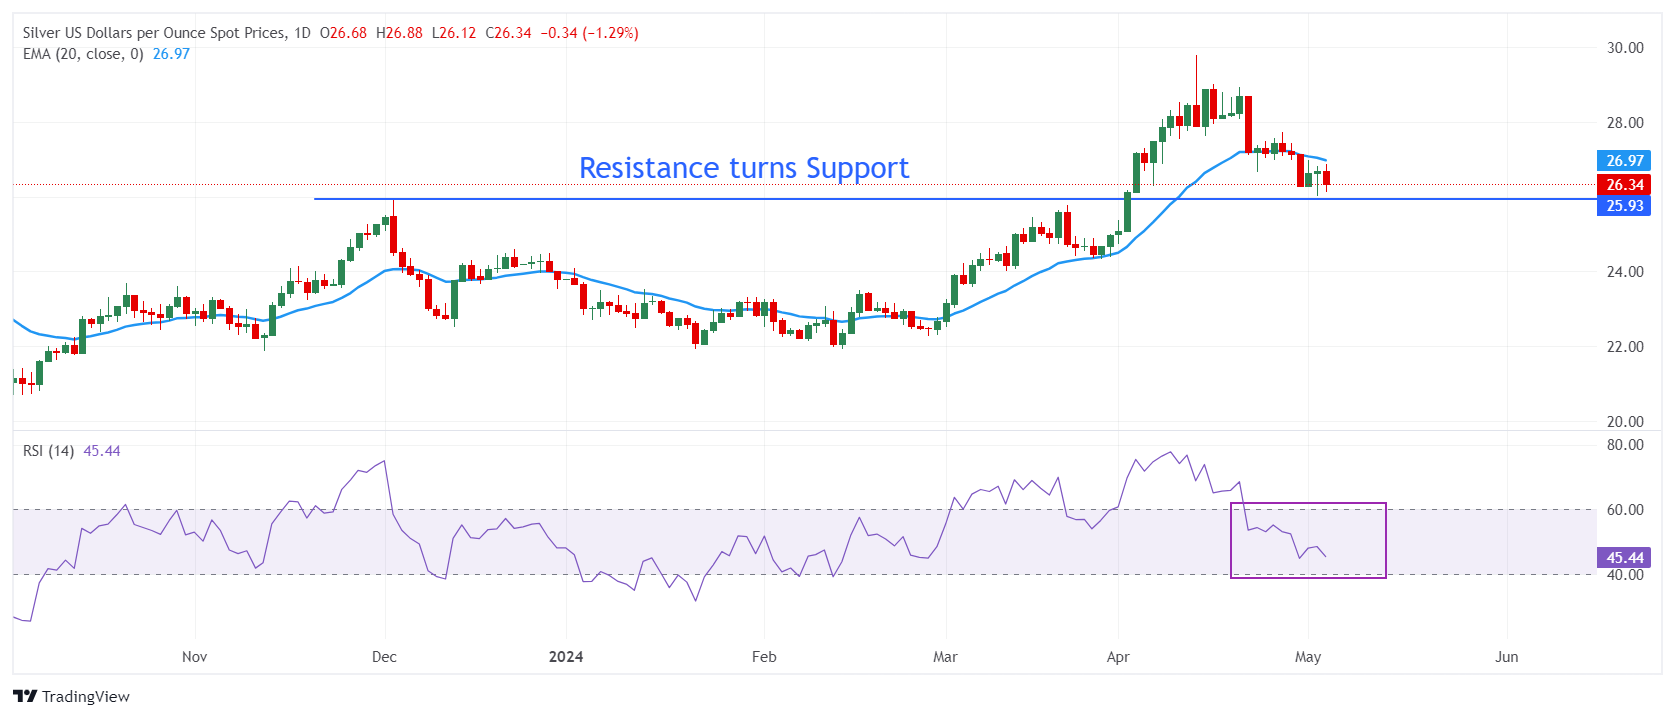
Silver price declines to near the horizontal support plotted from 14 April 2023 high around $26.09 on a daily timeframe. The above-mentioned support was earlier a major resistance for the Silver price bulls. The uncertainty over Silver’s near-term outlook deepens as it has slipped below the 20-period Exponential Moving Average (EMA), which trades around $27.20.
The 14-period Relative Strength Index (RSI) slips into the 40.00-60.00, suggesting that the bullish momentum has faded. However, the long-term outlook is still stable.
Silver daily chart
(Click on image to enlarge)
XAG/USD
| OVERVIEW | |
|---|---|
| Today last price | 26.34 |
| Today Daily Change | -0.34 |
| Today Daily Change % | -1.27 |
| Today daily open | 26.68 |
| TRENDS | |
|---|---|
| Daily SMA20 | 27.65 |
| Daily SMA50 | 25.7 |
| Daily SMA100 | 24.42 |
| Daily SMA200 | 23.82 |
| LEVELS | |
|---|---|
| Previous Daily High | 26.82 |
| Previous Daily Low | 26.02 |
| Previous Weekly High | 28.69 |
| Previous Weekly Low | 26.67 |
| Previous Monthly High | 29.8 |
| Previous Monthly Low | 24.75 |
| Daily Fibonacci 38.2% | 26.51 |
| Daily Fibonacci 61.8% | 26.32 |
| Daily Pivot Point S1 | 26.19 |
| Daily Pivot Point S2 | 25.7 |
| Daily Pivot Point S3 | 25.39 |
| Daily Pivot Point R1 | 27 |
| Daily Pivot Point R2 | 27.31 |
| Daily Pivot Point R3 | 27.8 |
More By This Author:
Silver Price Forecast: XAG/USD Bounces Back To $26.60 After Weak US Manufacturing PMI ReportUSD/CAD Remains Supported Above 1.3640 Ahead Of Fed’s Policy Announcement
EUR/USD Surrenders Intraday Gains Ahead Of US, Eurozone Data-Packed Week
Information on this article contains forward-looking statements that involve risks and uncertainties. Markets and instruments profiled on this page are for informational purposes only and should not ...
more

