
Silver price (XAG/USD) plummets below the psychological support of $30.00 in Friday’s New York session. The white metal plunges after the United States Nonfarm Payrolls (NFP) report May showed that labor demand remains robust and the wage growth momentum was stronger than expected.
Fresh payrolls came in higher at 272K than expectations of 185K and the prior release of 165K. Average Hourly Earnings rose strongly by 0.4% from the estimates of 0.3% and the former release of 0.2% on a month-on-month basis. Average Hourly Earnings data is a measure of wage inflation, which directs households’ spendings. Annual wage inflation measure grew by 4.1%, beats the estimate of 3.9% and April’s read of 4.0%.
Strong payrolls and wage growth data prompt the need to maintain a restrictive interest rate framework by the Federal Reserve (Fed) for a longer period, which is a favourable situation for yields on interest-bearing assets and the US Dollar. 10-year US Treasury yields rally 4.43%, up by 3.5% from Thursday’s close. The US Dollar Index (DXY), which tracks the Greenback’s value against six major currencies, jumps to 104.80. Higher yields on interest-bearing assets increase the opportunity cost of holding an investment in non-yielding assets, such as Silver.
The white metal was already under pressure as People’s Bank of China’s (PBoC) gold reserves report for May showed that their 18-month long Gold buying spell paused for a while. The report showed that gold reserves were unchanged at 72.80 million fine troy oz.
Silver technical analysis
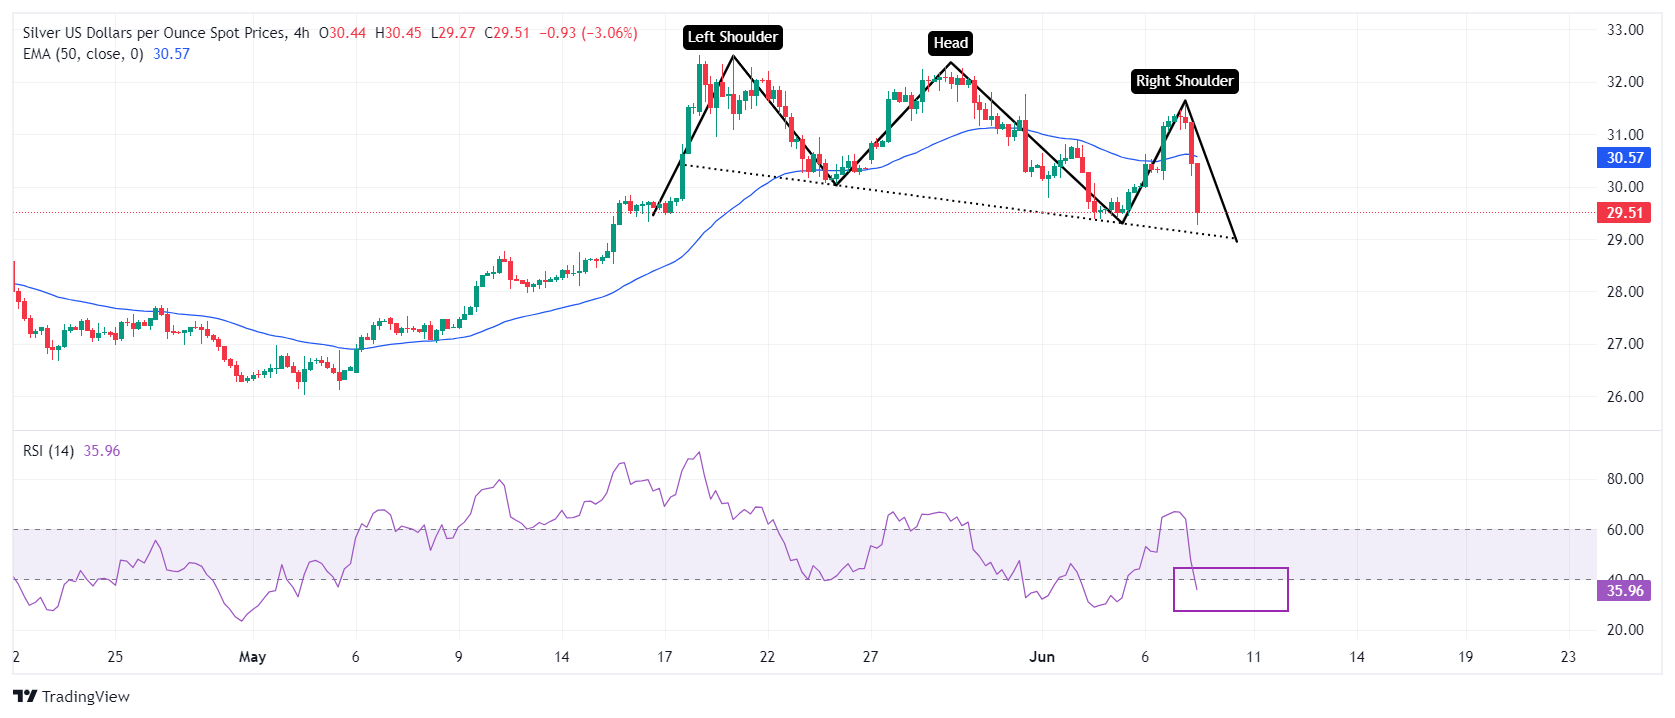
Selling pressure in the Silver price indicates that it could deliver a breakdown of the Head and Shoulder chart pattern formed on a four-hour timeframe. The neckline of the above-mentioned chart pattern appears to be around $29.00. A decisive break below the same would result in a bearish reversal.
Spot prices have dropped below the 50-period Exponential Moving Average (EMA) near $30.50, suggesting that the near-term outlook turns bearish.
The 14-period Relative Strength Index (RSI) has slipped below 40.00. A sustained move below the same will push the momentum towards the downside.
Silver four-hour chart
(Click on image to enlarge)
XAG/USD
| OVERVIEW | |
|---|---|
| Today last price | 29.49 |
| Today Daily Change | -1.83 |
| Today Daily Change % | -5.84 |
| Today daily open | 31.32 |
| TRENDS | |
|---|---|
| Daily SMA20 | 30.49 |
| Daily SMA50 | 28.6 |
| Daily SMA100 | 25.99 |
| Daily SMA200 | 24.61 |
| LEVELS | |
|---|---|
| Previous Daily High | 31.35 |
| Previous Daily Low | 29.97 |
| Previous Weekly High | 32.3 |
| Previous Weekly Low | 30.19 |
| Previous Monthly High | 32.51 |
| Previous Monthly Low | 26.02 |
| Daily Fibonacci 38.2% | 30.82 |
| Daily Fibonacci 61.8% | 30.5 |
| Daily Pivot Point S1 | 30.41 |
| Daily Pivot Point S2 | 29.5 |
| Daily Pivot Point S3 | 29.04 |
| Daily Pivot Point R1 | 31.78 |
| Daily Pivot Point R2 | 32.25 |
| Daily Pivot Point R3 | 33.16 |
More By This Author:
USD/CHF Appears To Be On Backfoot Amid Subdued US Dollar Ahead Of US NFPSilver Price Forecast: XAG/USD Extends Recovery To $30.60 On Firm Fed Rate-Cut Prospects
USD/CAD Advances Toward 1.3700 Ahead Of US Data, BoC Policy Meeting


Comments
Log in or sign up to join the conversation.