

Image Source: Pixabay
Silver price (XAG/USD) is extending its losses for the third successive session, trading around $32.30 per troy ounce during the European session on Thursday. The technical analysis of the daily chart suggests a potential bearish shift, with the grey metal falling below the existing ascending channel pattern.
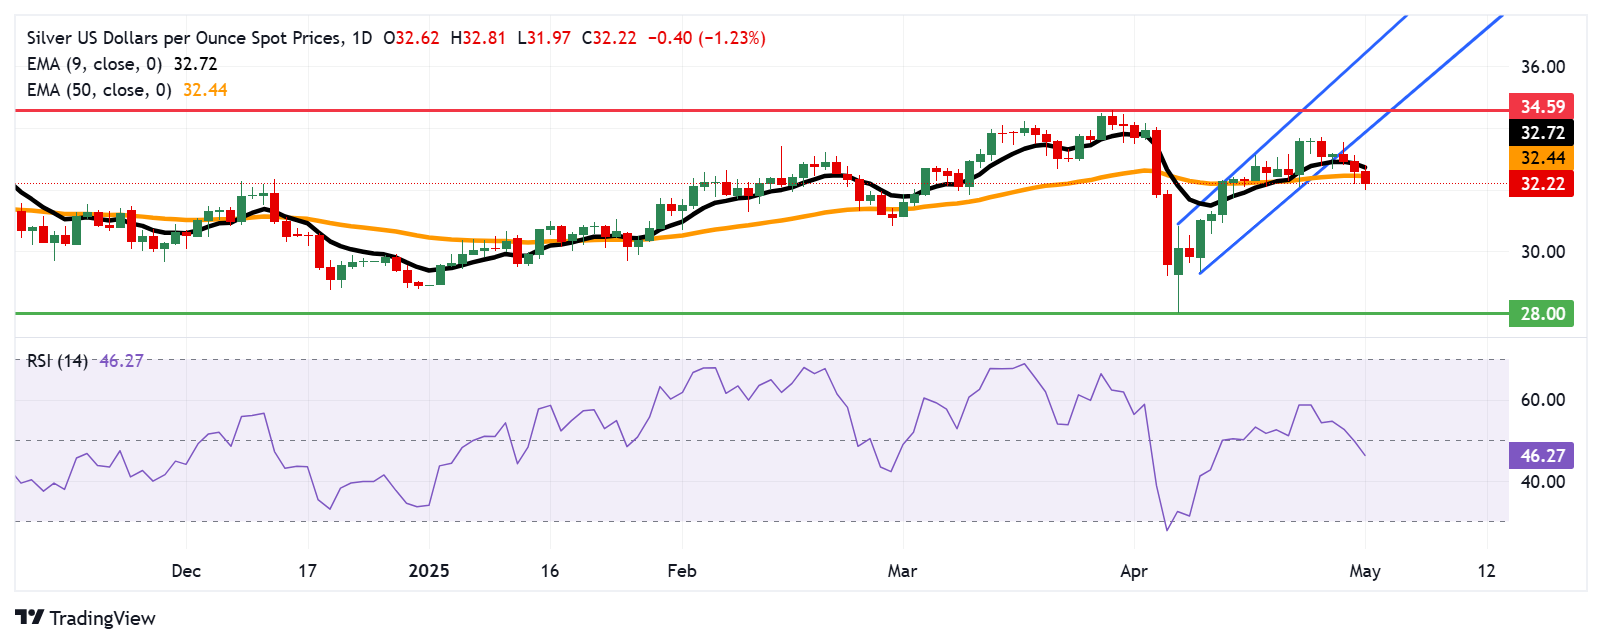
Silver price remains below both the nine- and 50-day Exponential Moving Averages (EMAs), indicating an ongoing weaker short-term price momentum. Furthermore, the 14-day Relative Strength Index (RSI) breaks below the 50 level, suggesting the bearish bias is active.
On the downside, the Silver price could navigate the region around the $30.00 support area. A break below this level could put downward pressure on the precious metal to test the eight-month low of $28.00, marked on April 7.
On the upside, the XAG/USD pair is testing the 50-day EMA at $32.44, followed by the nine-day EMA at the $32.72 level. A break above these levels could revive the short-term price momentum and support the pair to return to the ascending channel pattern. A further barrier appears around the seven-month high at $34.59, last seen on March 28.
XAG/USD: Daily Chart
(Click on image to enlarge)
More By This Author:
EUR/JPY Holds Ground Near 162.50 Following Key Economic Data From GermanyUSD/CAD Holds Gains Near 1.3850 As Trade Optimism Supports US Dollar
Australian Dollar Rises As Inflationary Pressures Weaken Odds Of An RBA's Rate Cut In May


Comments
Log in or sign up to join the conversation.